Custom visuals for Power BI give you richer, purpose-built ways to explore and present your data
Use Visuals when native Power BI visuals don't give you the layout or flexibility you need. They’re ideal when you want advanced features tailored to specific scenarios, like financial reporting, project planning, or risk management. Our visuals also help you standardize how insights are presented to stakeholders, so every report tells the story in a clear, consistent way.
No items found.
Feature Overview
No items found.
Moduler som ingår
Varje ingående modul kopplas direkt till produkten och tillför fokuserad funktionalitet för ert team.
Financial Reporting Matrix
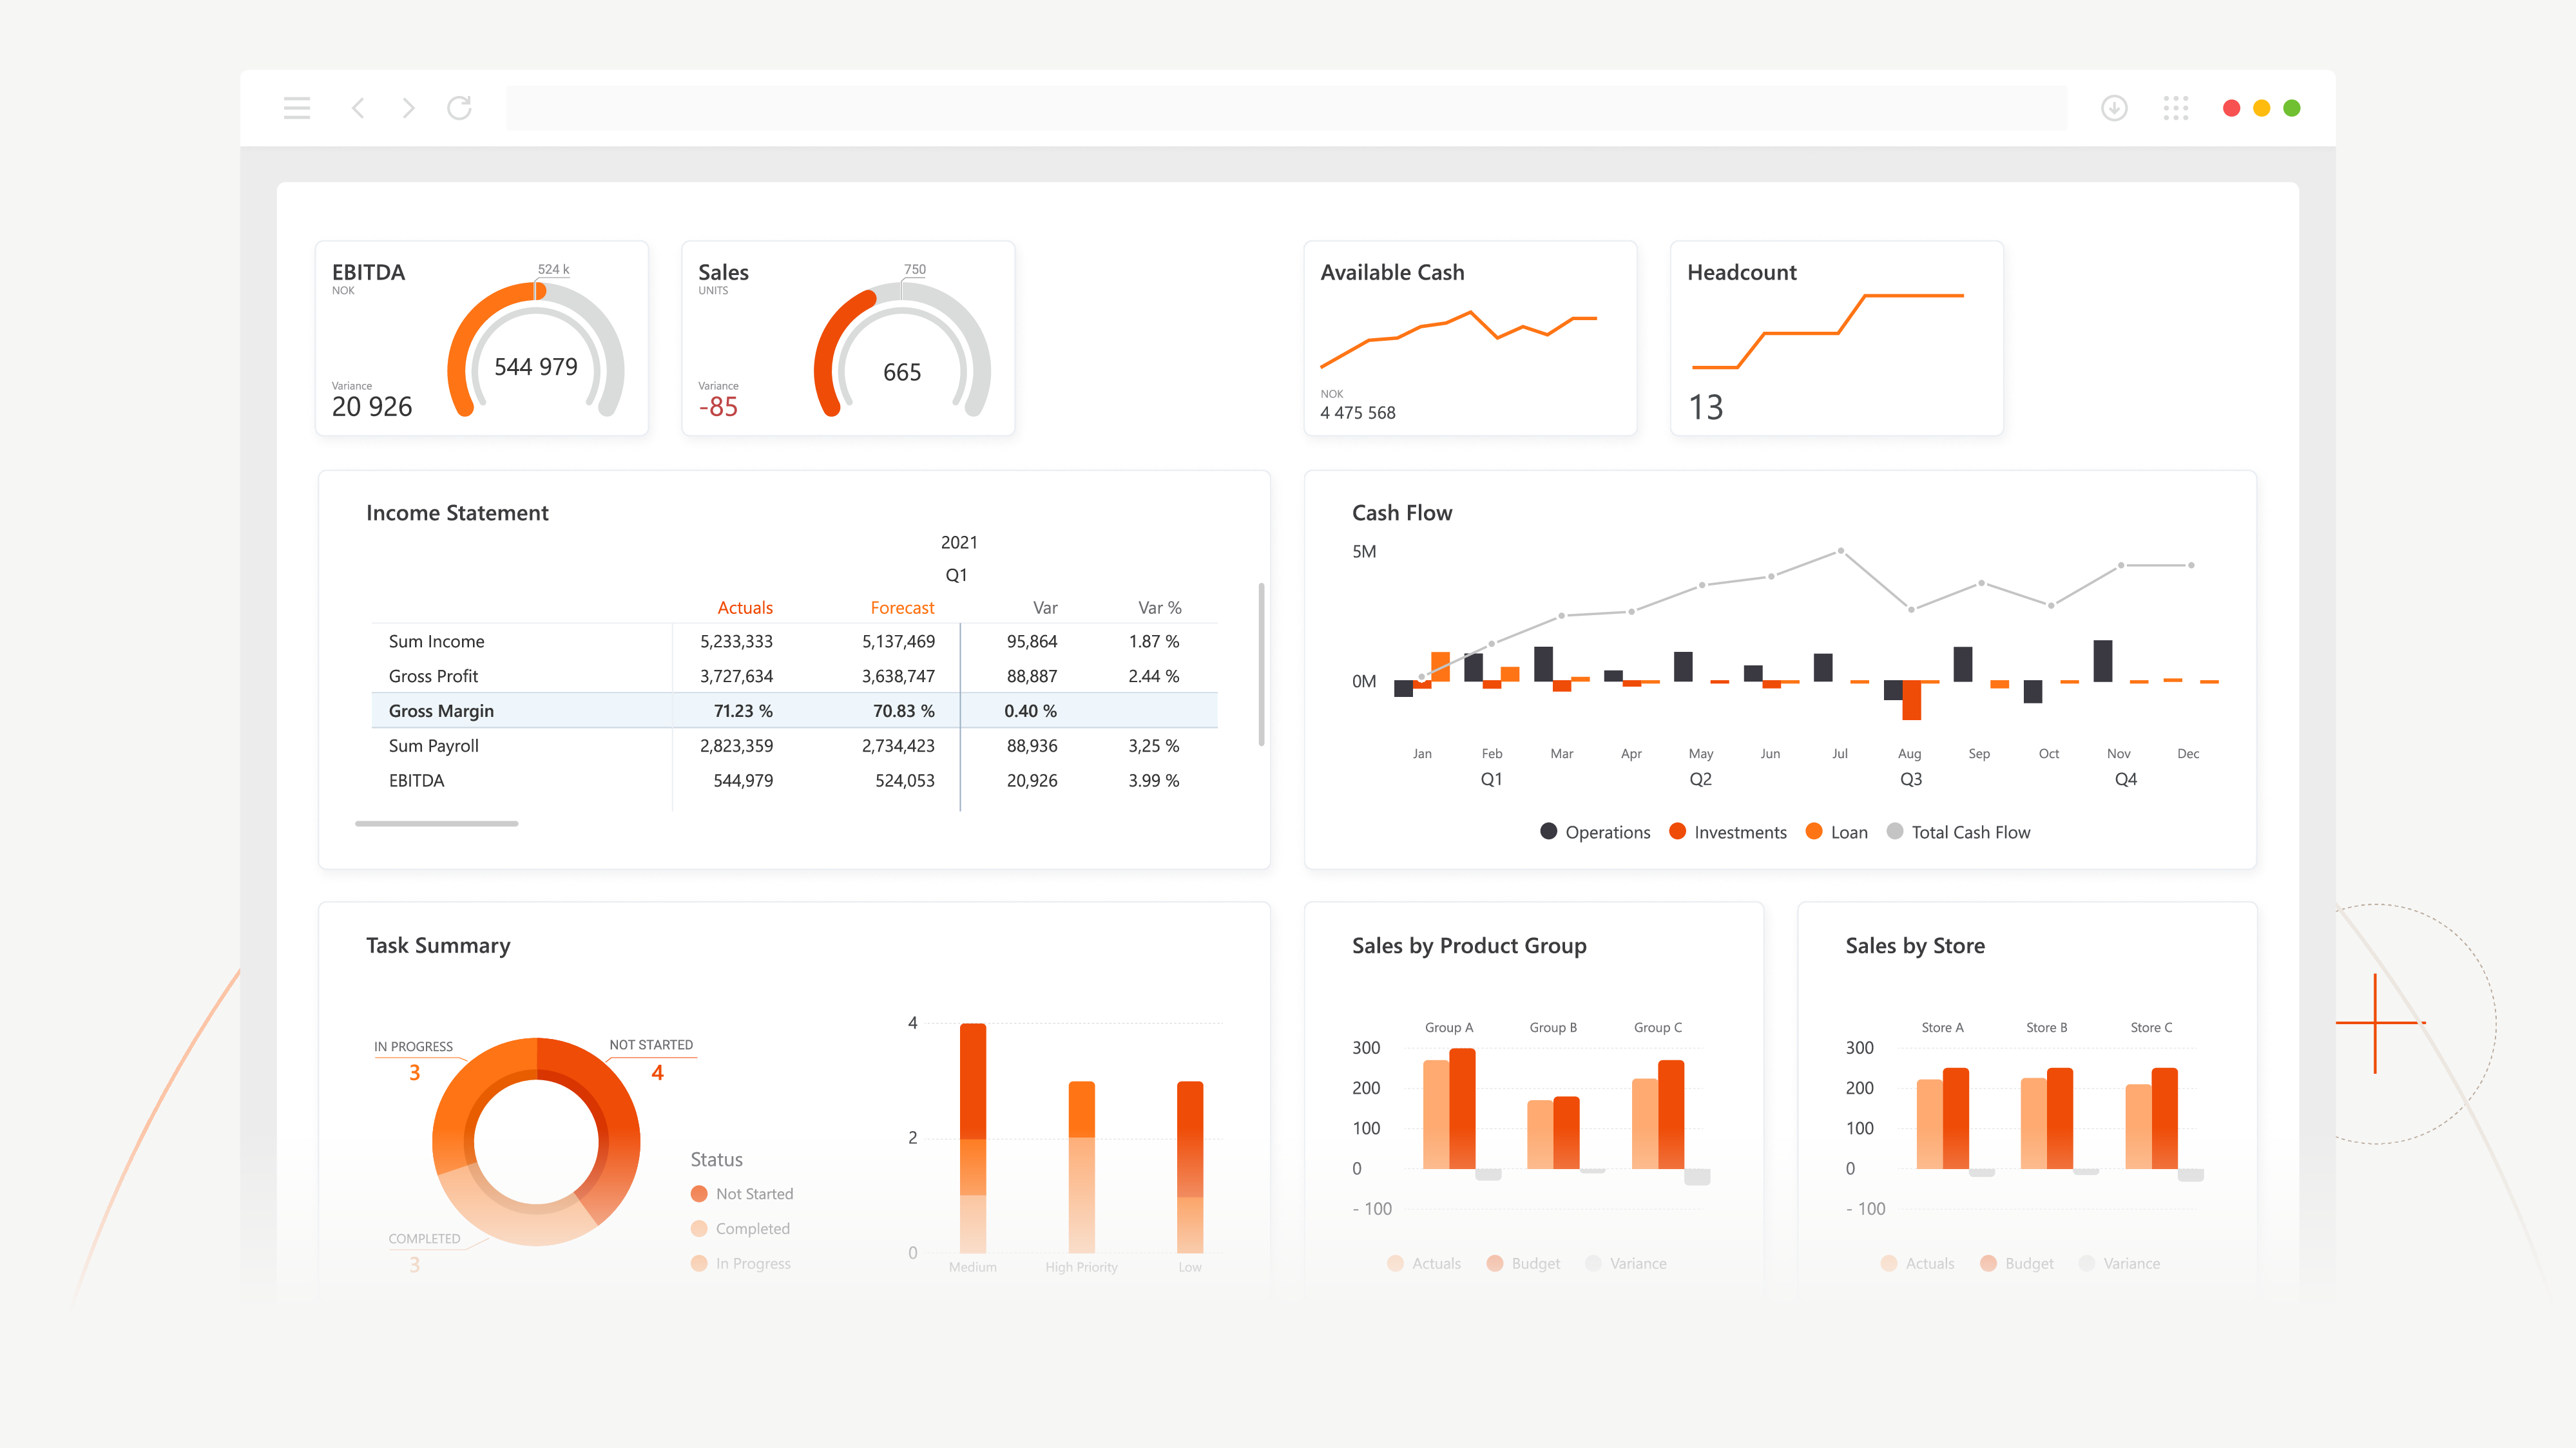
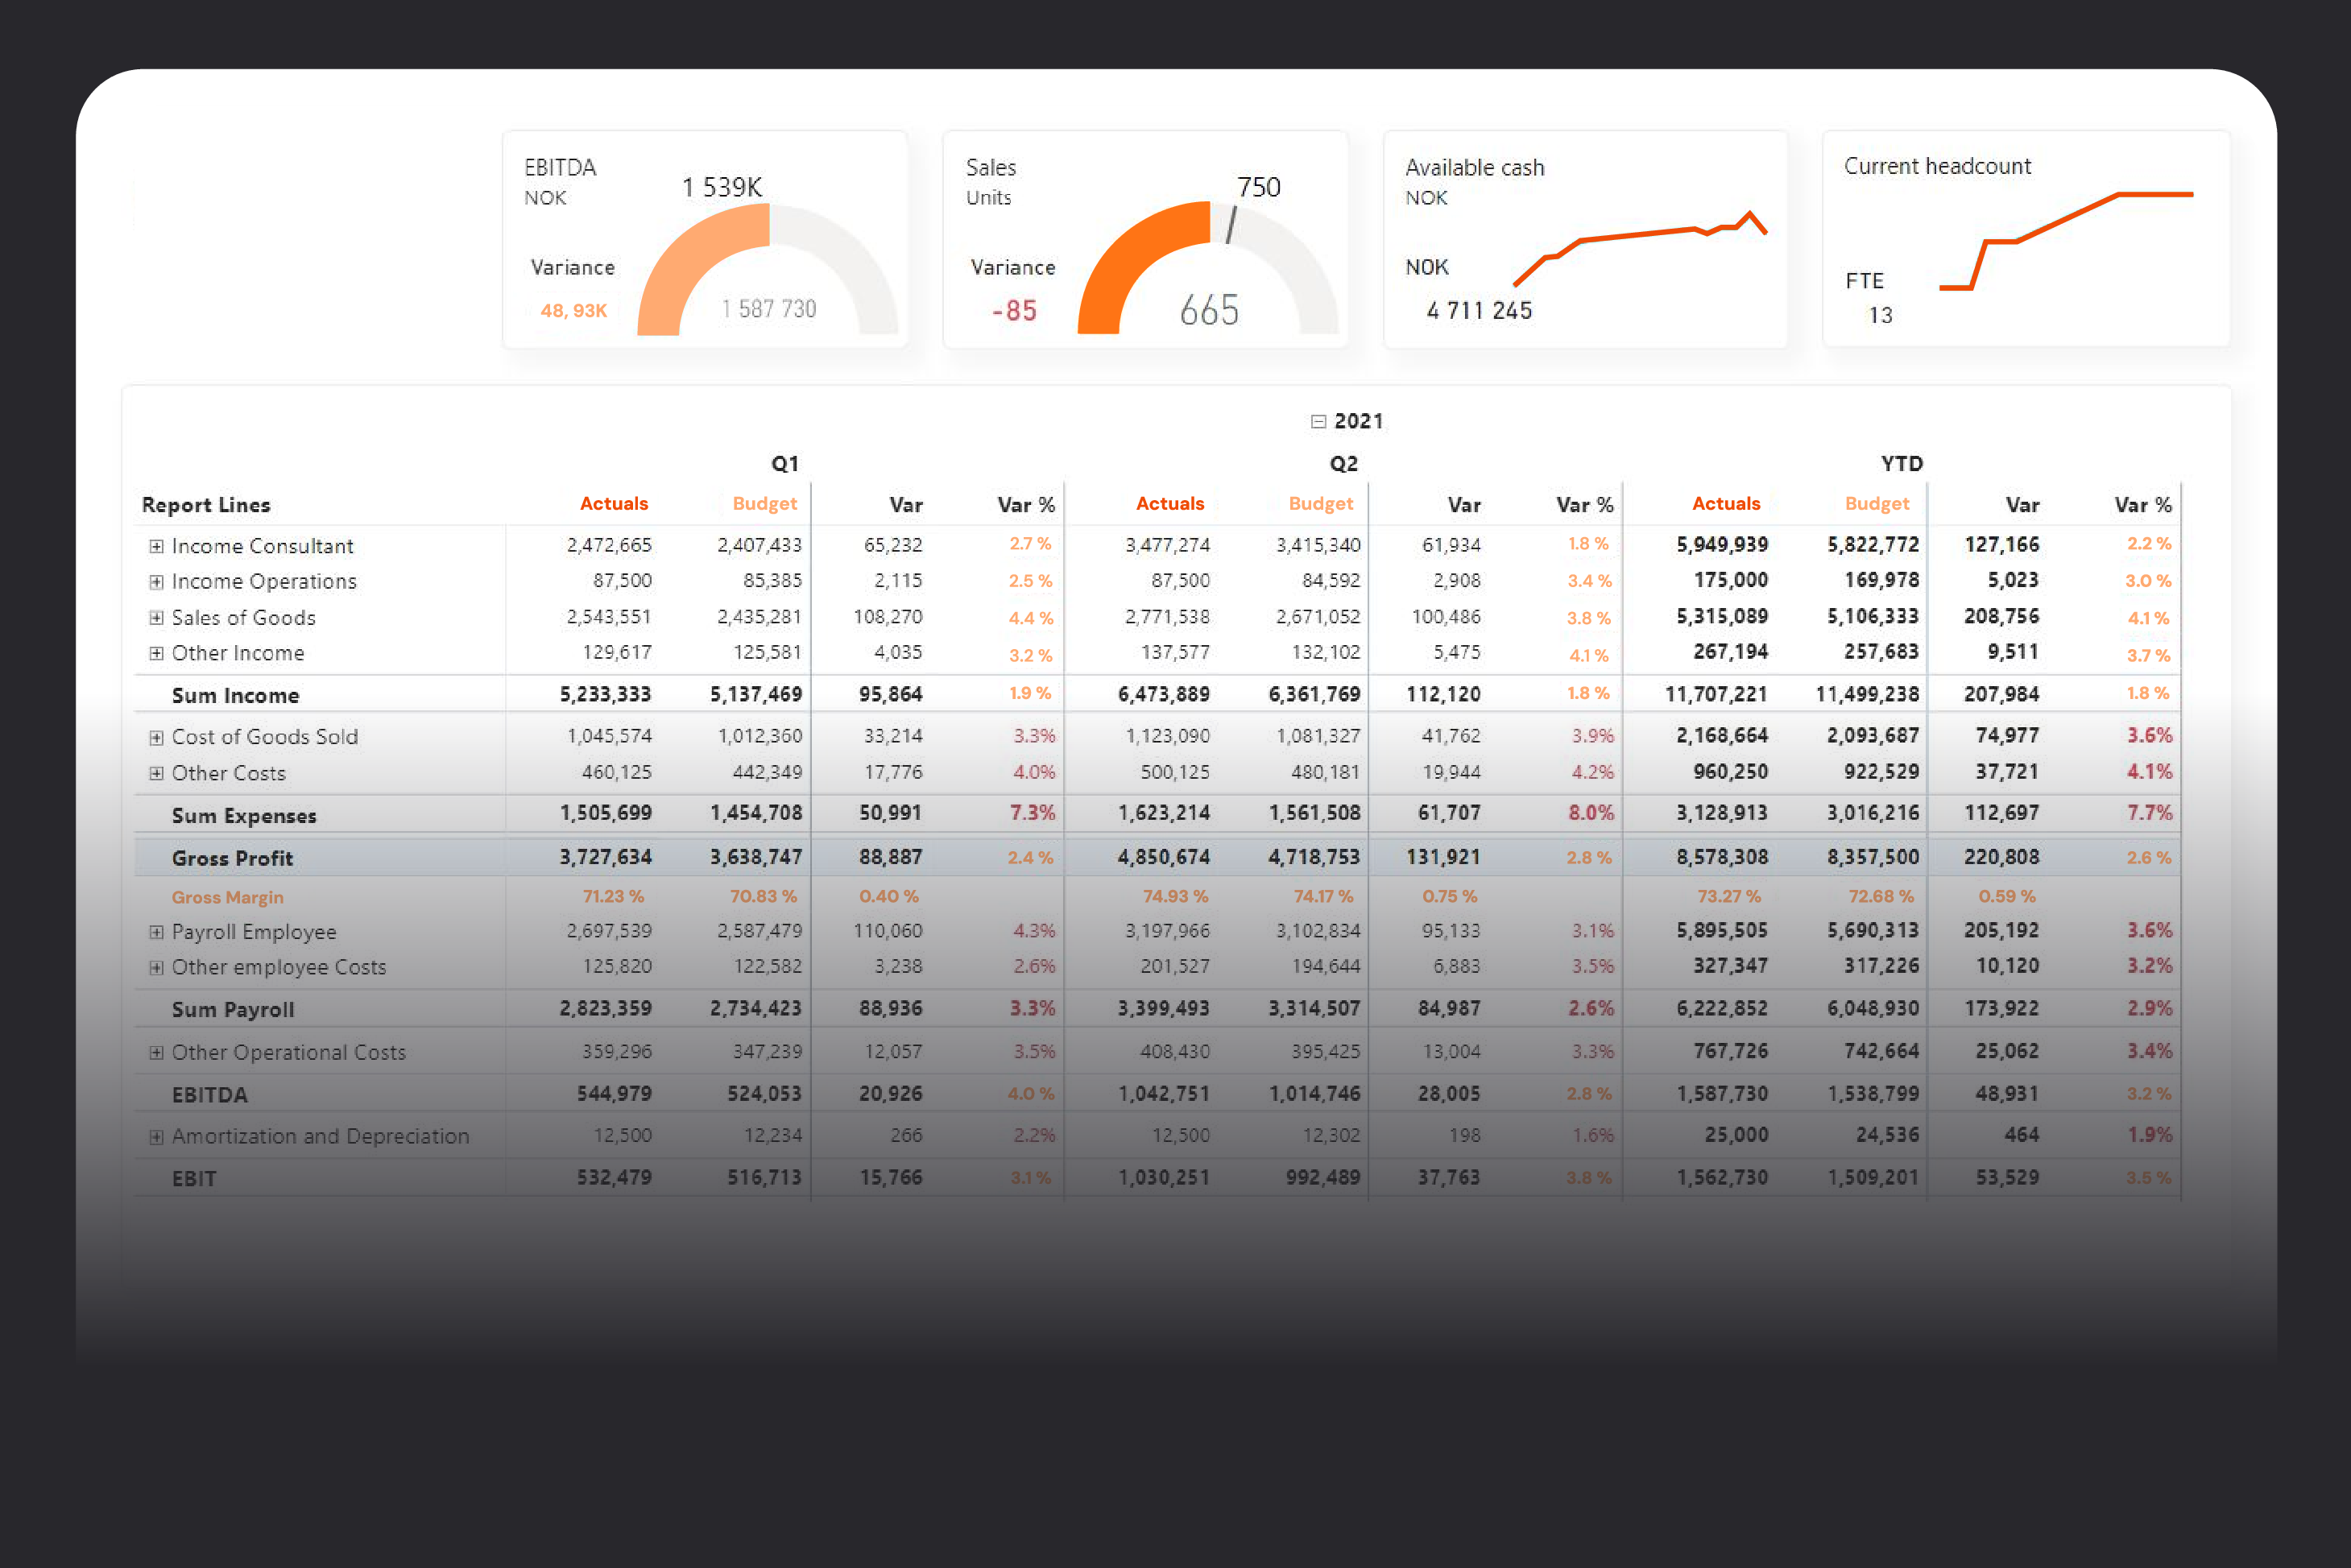
Finance teams still depend on complex Excel workbooks that are hard to maintain, slow to update, and nearly impossible to standardize across entities. Financial Reporting Matrix is a Power BI visual built specifically for financial statements, letting you design P&L, balance sheet, and cash flow reports with proper layouts, subtotals, hierarchies, and conditional formatting directly on your existing data model. The result is dynamic, always up-to-date reports that cut manual spreadsheet work and give stakeholders a single, trusted view of the numbers.
Extra
Financial Reporting Matrix
Finance teams still depend on complex Excel workbooks that are hard to maintain, slow to update, and nearly impossible to standardize across entities. Financial Reporting Matrix is a Power BI visual built specifically for financial statements, letting you design P&L, balance sheet, and cash flow reports with proper layouts, subtotals, hierarchies, and conditional formatting directly on your existing data model. The result is dynamic, always up-to-date reports that cut manual spreadsheet work and give stakeholders a single, trusted view of the numbers.
Extra
GANTT
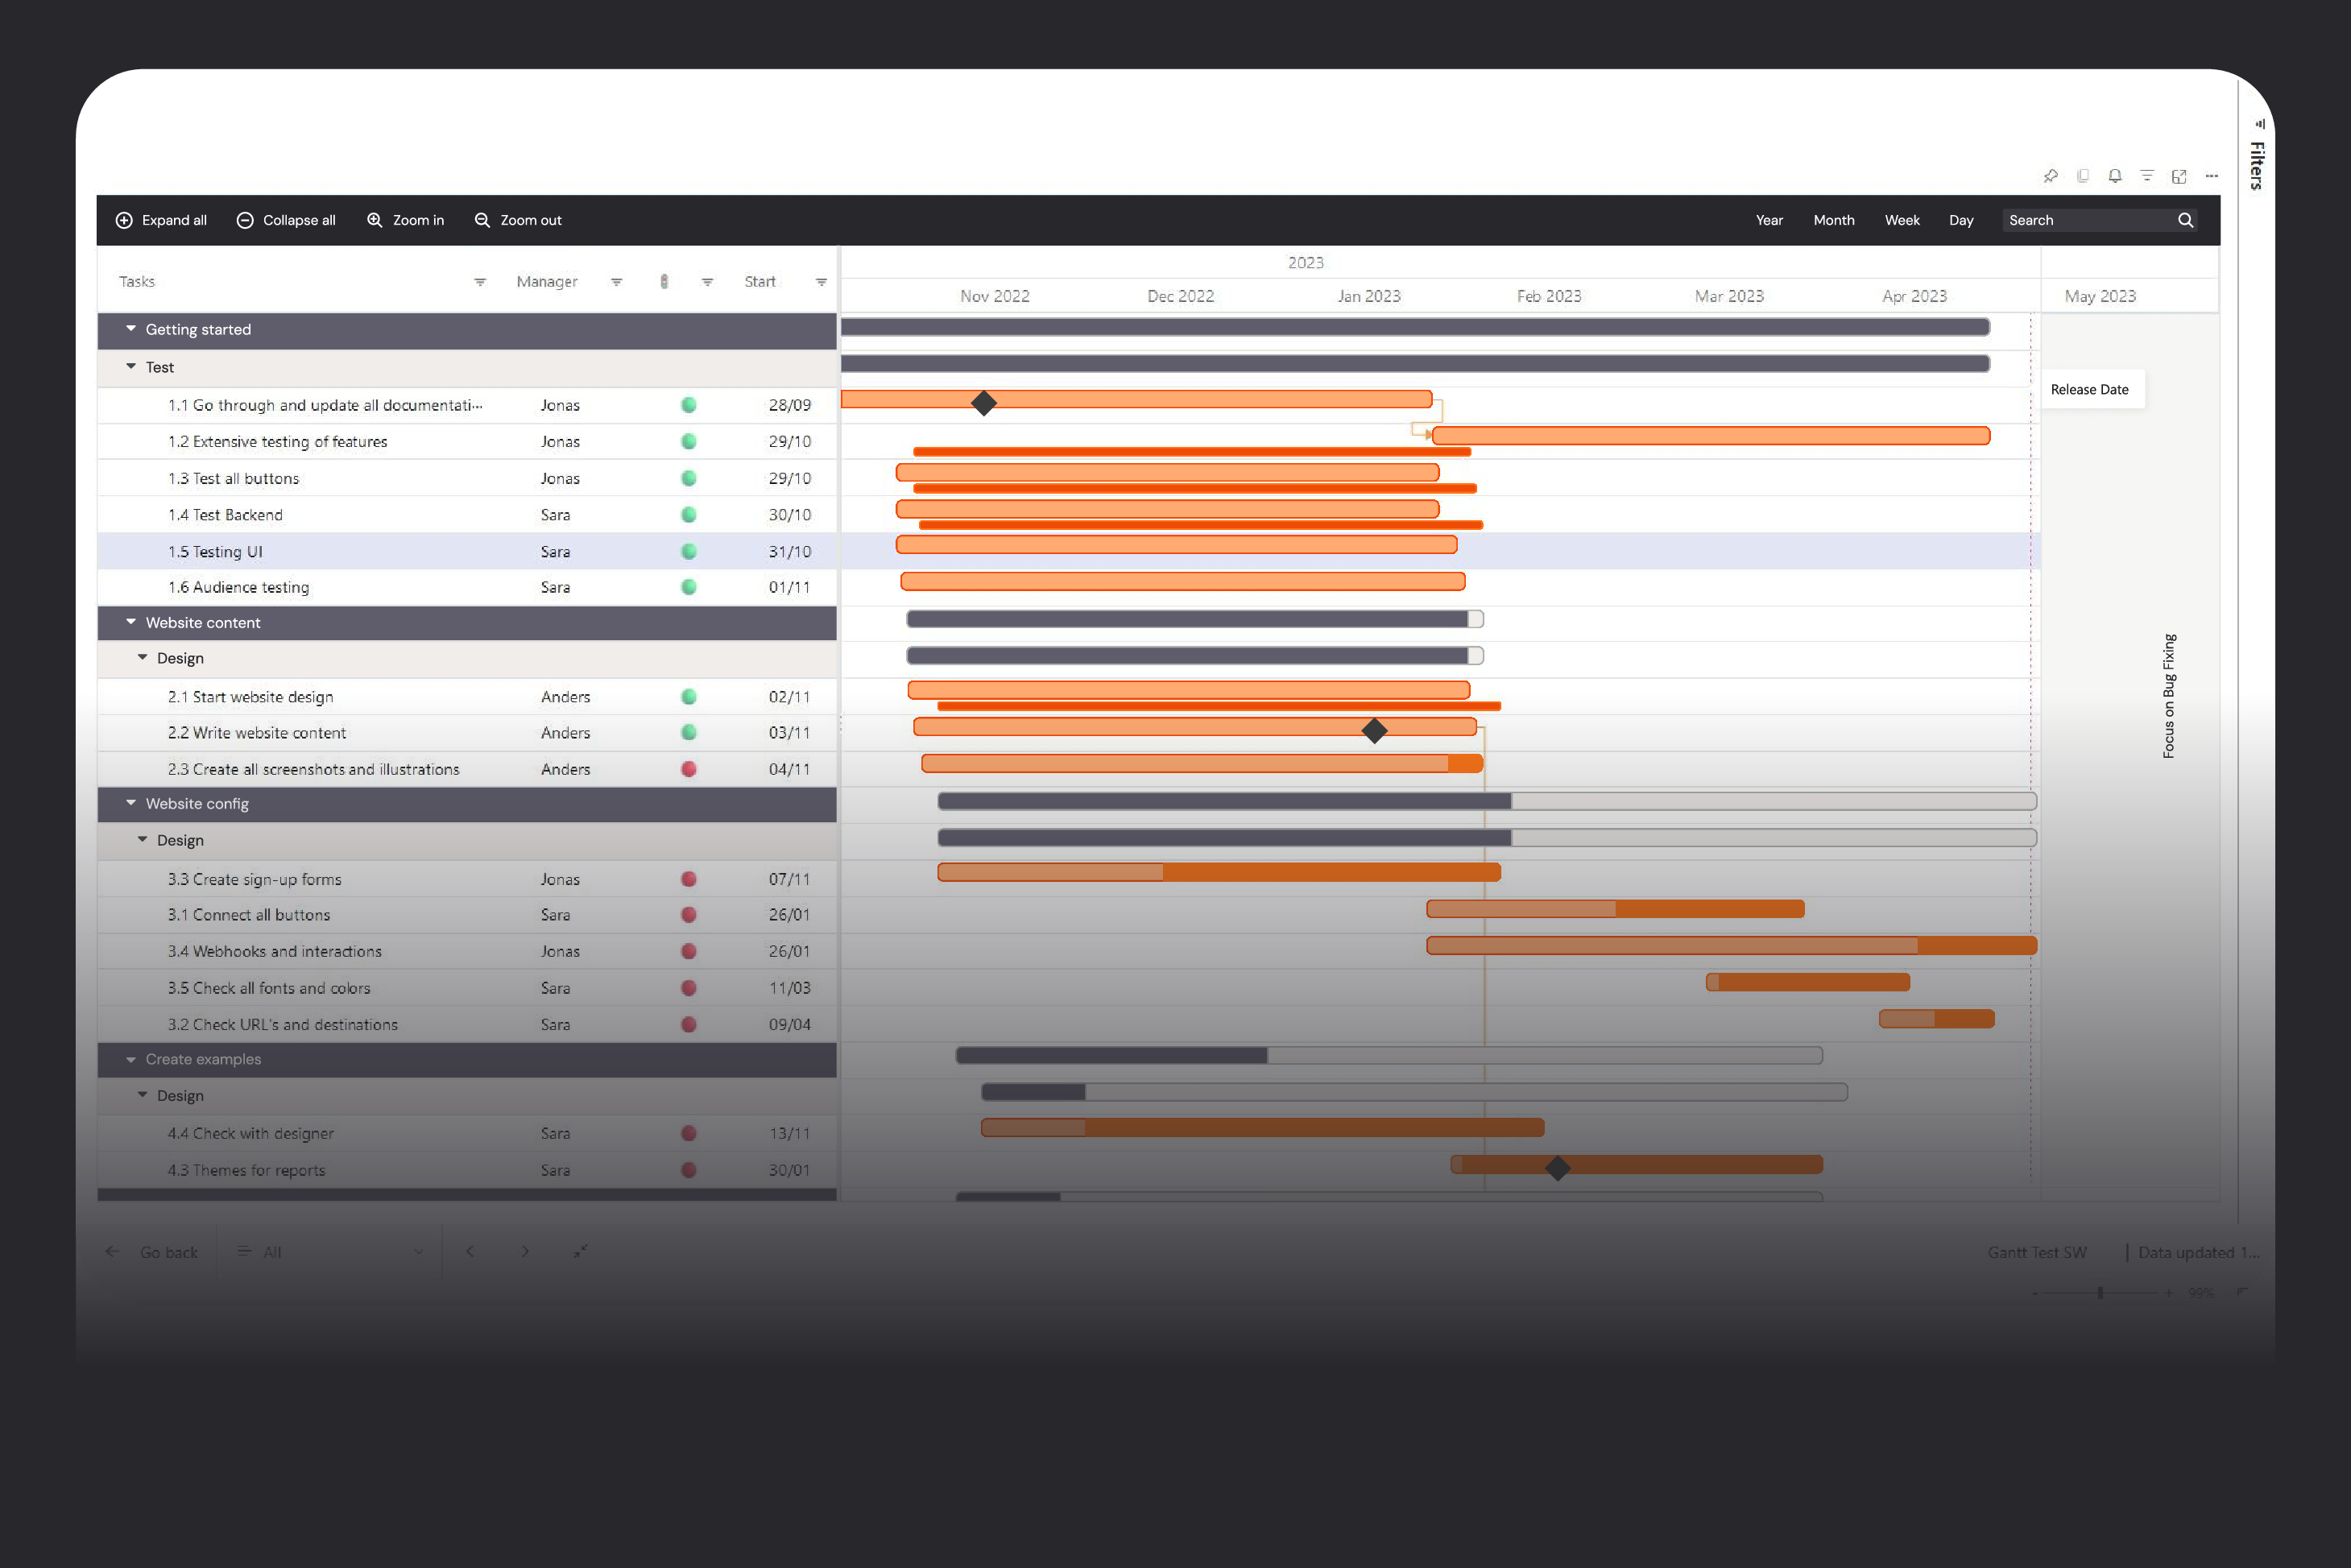
Project and resource plans often live in complex planning tools that only a few people can use, while everyone else manages with outdated PDFs, screenshots, or spreadsheets. Gantt by Profitbase is a Microsoft‑certified Power BI visual that takes plans from your existing systems and displays them as an interactive Gantt chart with unlimited hierarchy, milestones, and events—without allowing accidental edits. This lets planners keep full control in the planning tool while stakeholders get a clear, always‑up‑to‑date view of timelines, progress, and dependencies directly in Power BI.
Extra
GANTT
Project and resource plans often live in complex planning tools that only a few people can use, while everyone else manages with outdated PDFs, screenshots, or spreadsheets. Gantt by Profitbase is a Microsoft‑certified Power BI visual that takes plans from your existing systems and displays them as an interactive Gantt chart with unlimited hierarchy, milestones, and events—without allowing accidental edits. This lets planners keep full control in the planning tool while stakeholders get a clear, always‑up‑to‑date view of timelines, progress, and dependencies directly in Power BI.
Extra
Risk Matrix
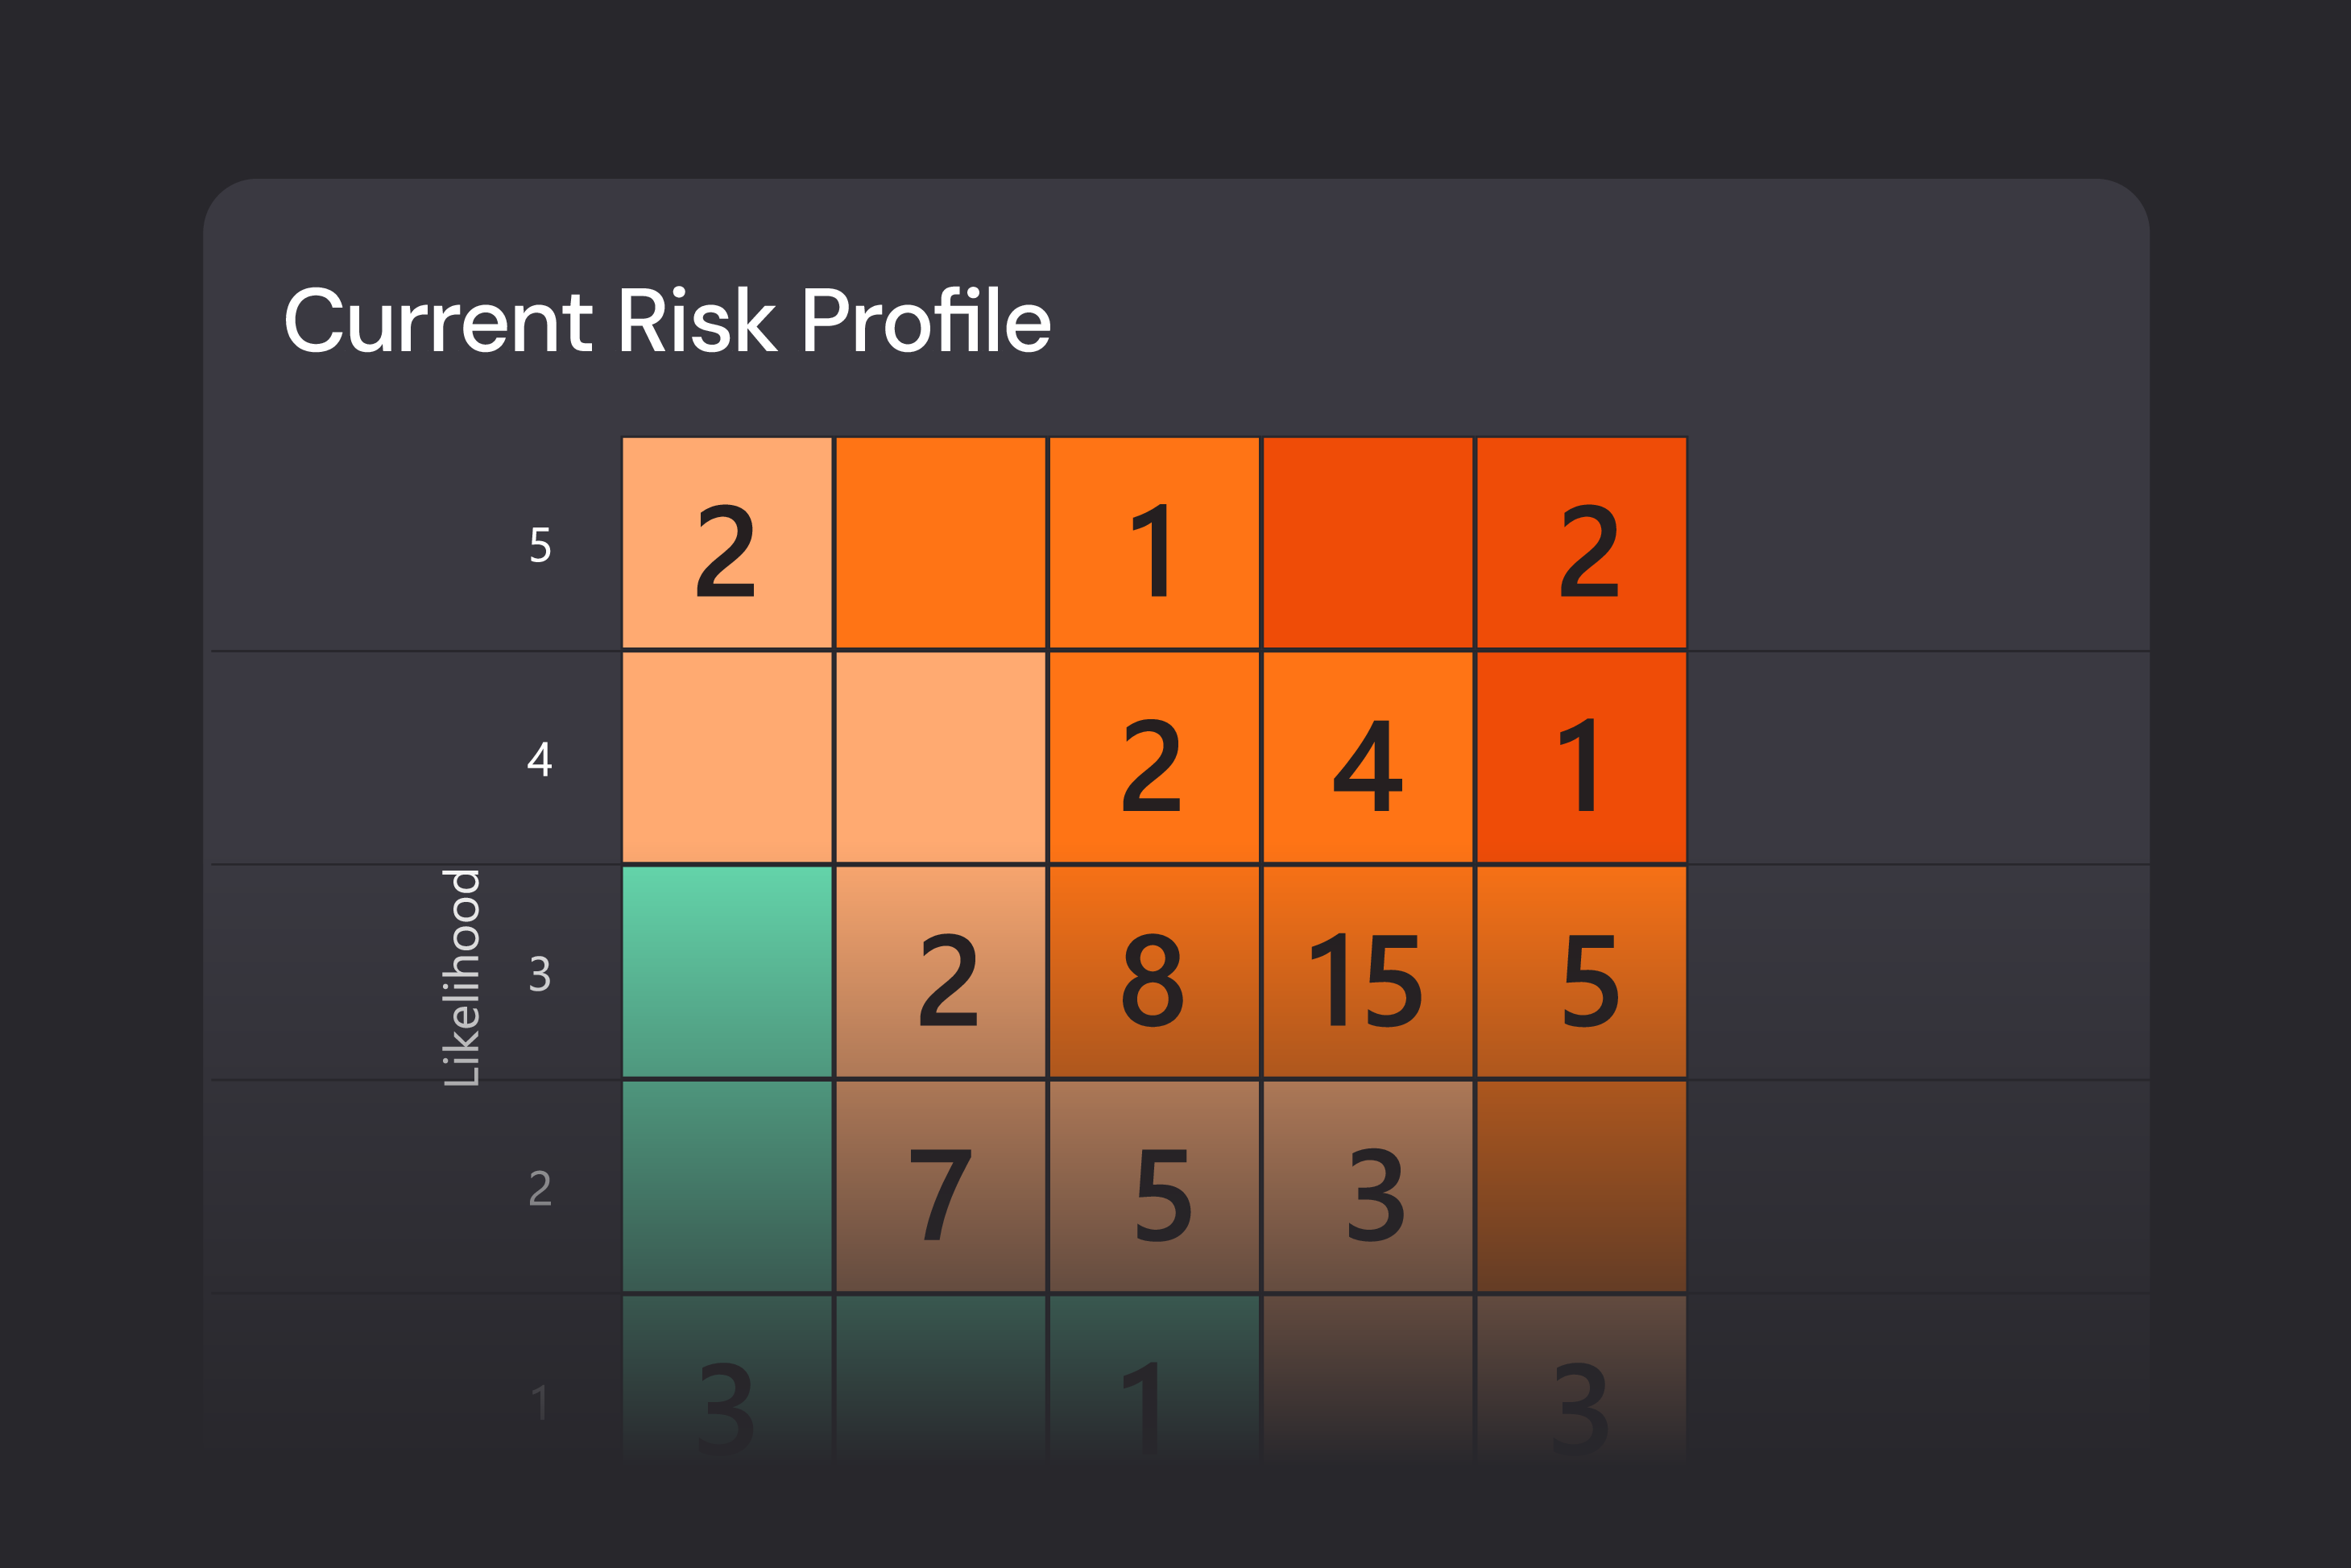
A risk matrix is one of the most familiar and effective ways to identify, assess, and communicate risk—but in many organizations it still lives in static slides and spreadsheets. Risk Matrix by Profitbase is a Microsoft‑certified Power BI visual that turns your risk register into a dynamic, fully customizable matrix, showing likelihood versus impact with bubble size driven by business‑critical metrics such as financial exposure. It lets you see both the big picture and the details, and use the matrix as an interactive starting point for deeper risk analysis in your dashboards.
Extra
Risk Matrix
A risk matrix is one of the most familiar and effective ways to identify, assess, and communicate risk—but in many organizations it still lives in static slides and spreadsheets. Risk Matrix by Profitbase is a Microsoft‑certified Power BI visual that turns your risk register into a dynamic, fully customizable matrix, showing likelihood versus impact with bubble size driven by business‑critical metrics such as financial exposure. It lets you see both the big picture and the details, and use the matrix as an interactive starting point for deeper risk analysis in your dashboards.
Extra
Kundcase
"Verksamhetsrapportering har gett oss bra förutsättningar för kvalitetshöjning i våra olika rapporteringar. Istället för att lägga tid på att ta ut siffror enligt separata anvisningar kan de som ska göra rapportering fokusera på själva analysen".
Elisabeth Pupp, arbetar med riskprocessen Lunds universitet
Elisabeth Pupp, arbetar med riskprocessen Lunds universitet
“Modulerna vi började med var väldigt användbara. Vi har digitaliserat många rapporter med hjälp av dem”,.
Linda Knutsson, EFS-rådet
Linda Knutsson, EFS-rådet
"Det här har inneburit helt andra och bättre möjligheter för oss på VGS att arbeta mer professionellt med lönsamhet per märke tillsammans med våra återförsäljare".
Malin Jansson, Business Management and Dealer Risk Management
Malin Jansson, Business Management and Dealer Risk Management

Turn complex data into clear decisions
Use custom Power BI visuals when standard visuals aren’t enough. Get the flexibility, advanced functionality, and consistent storytelling your stakeholders expect.