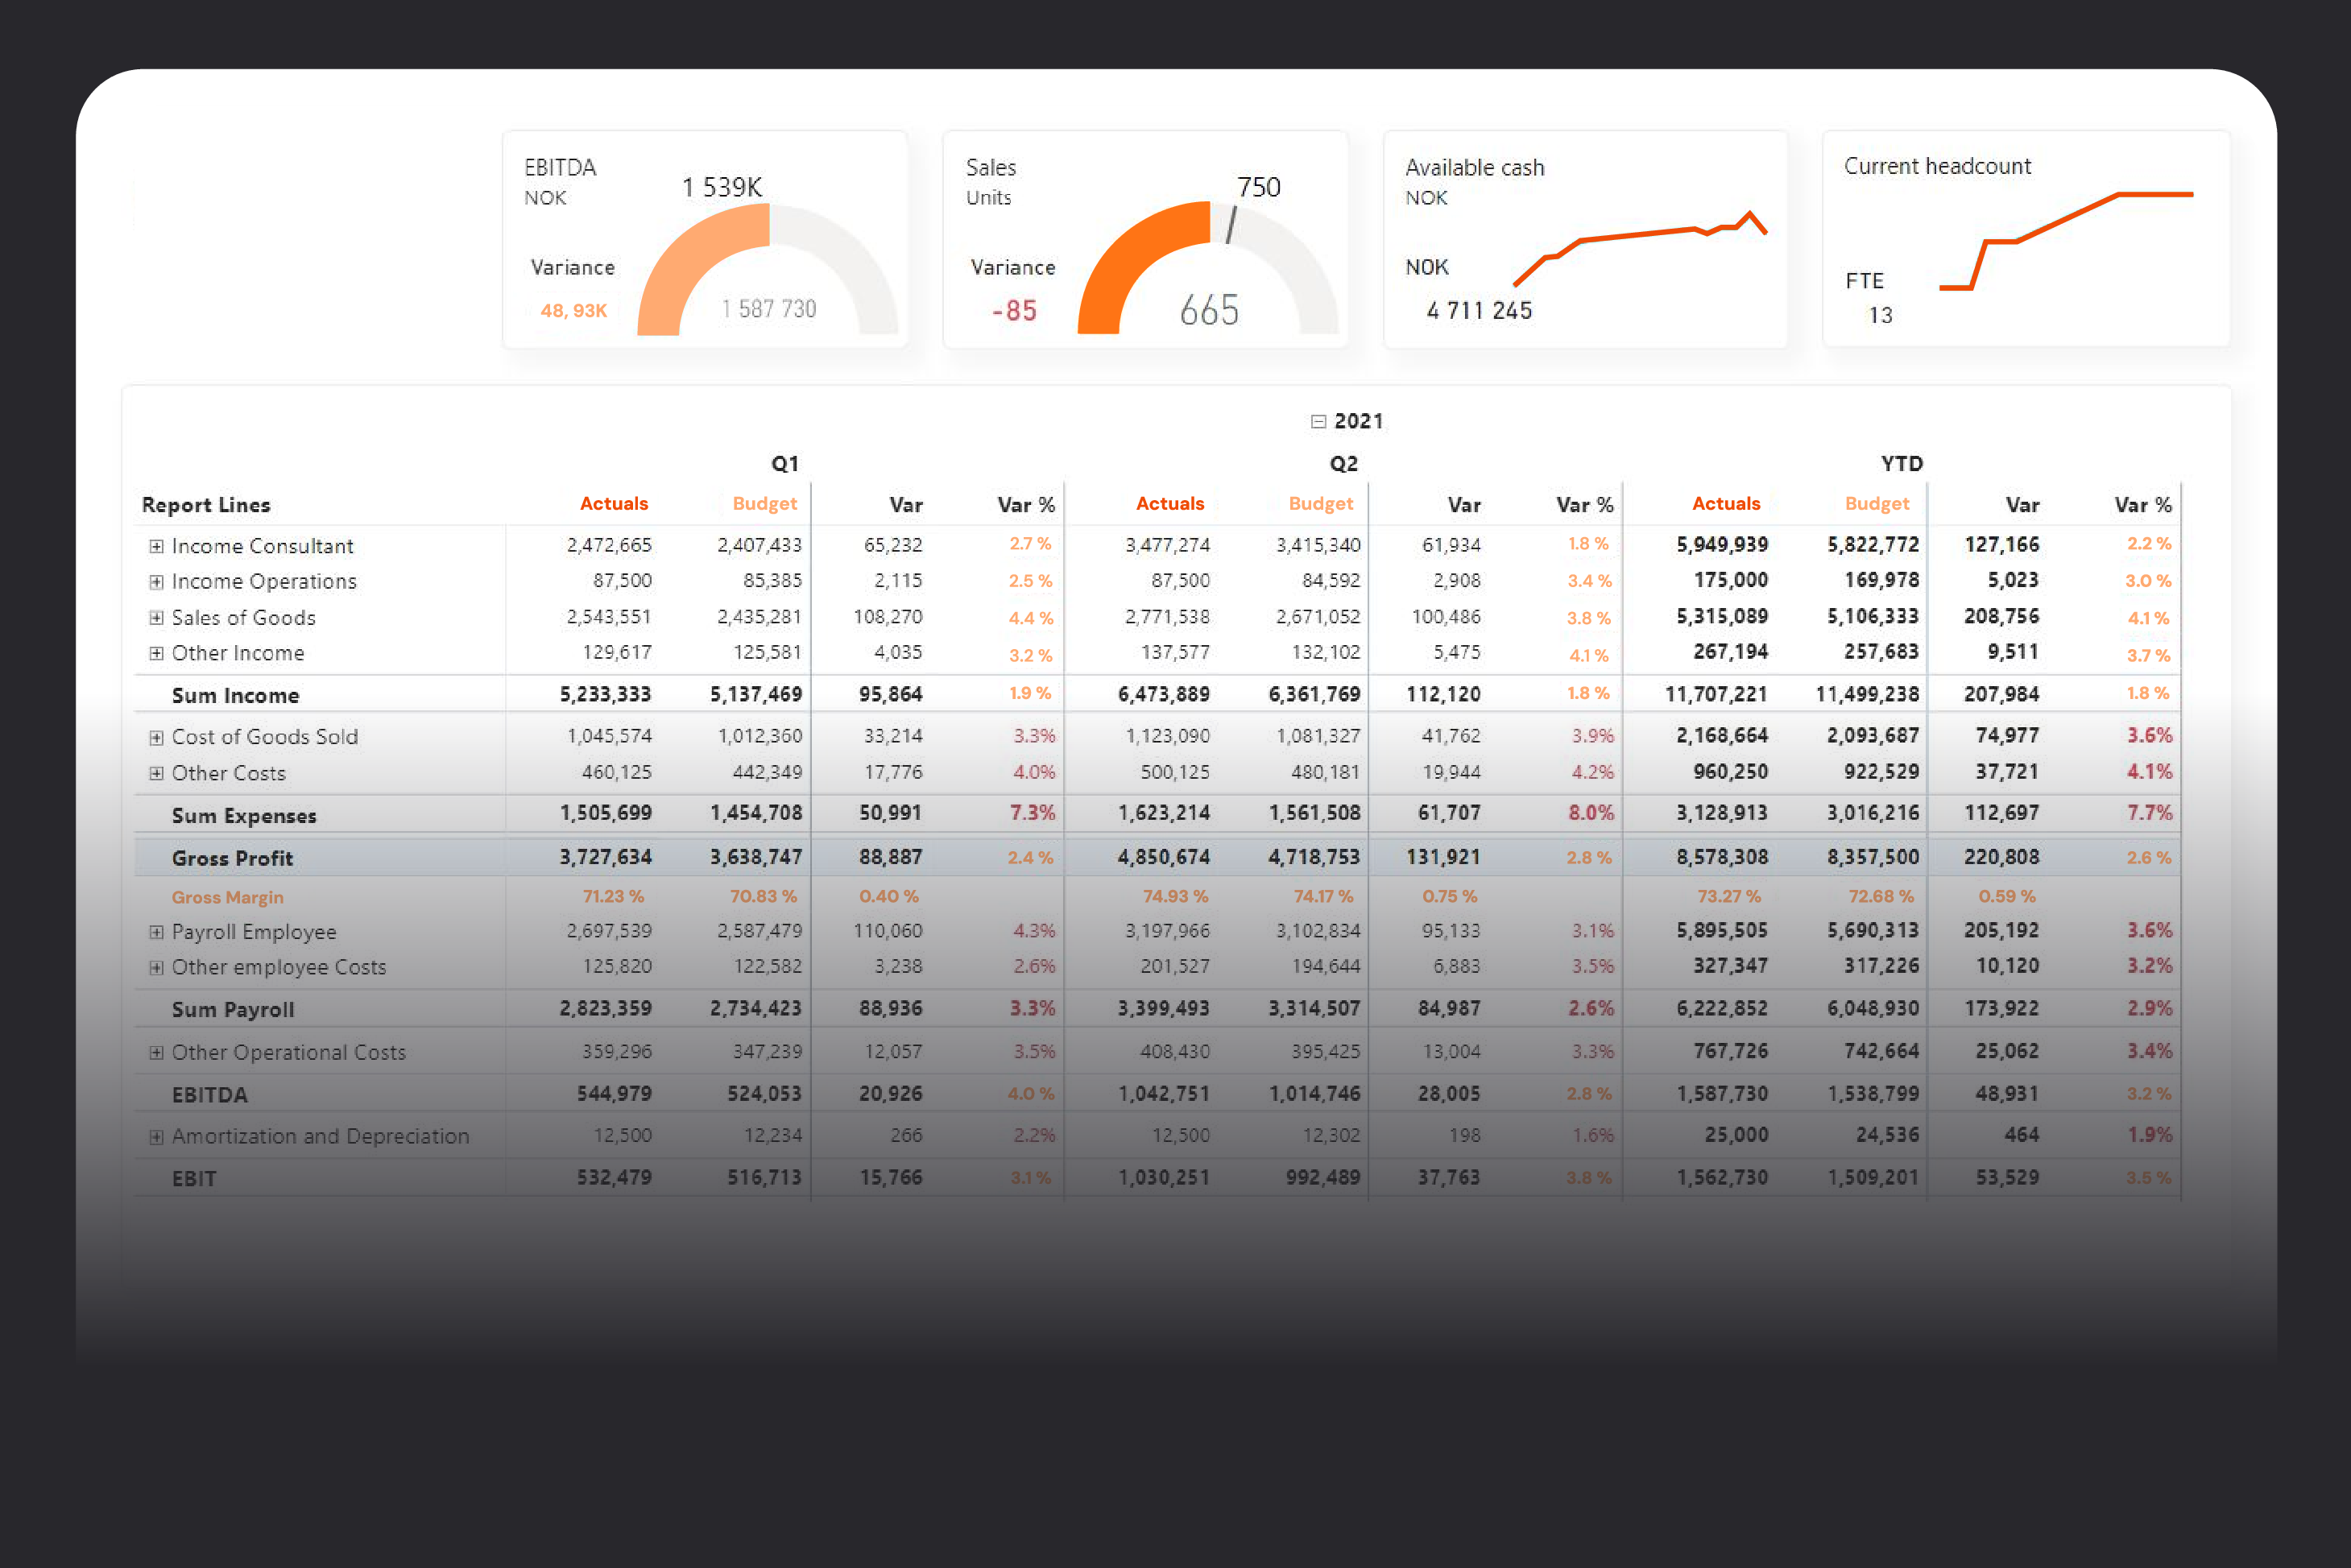
Create board-ready financial statements in Power BI
Finance teams still depend on complex Excel workbooks that are hard to maintain, slow to update, and nearly impossible to standardize across entities. Financial Reporting Matrix is a Power BI visual built specifically for financial statements, letting you design P&L, balance sheet, and cash flow reports with proper layouts, subtotals, hierarchies, and conditional formatting directly on your existing data model. The result is dynamic, always up-to-date reports that cut manual spreadsheet work and give stakeholders a single, trusted view of the numbers.
Designed for how you work
Move Finance to Power BI
Many finance teams want to modernize reporting but get stuck because their P&L and management reports “live” in Excel, with custom layouts and manual tweaks in every file. Migrating that logic into standard Power BI visuals often means compromising on layout, subtotals, and sign conventions, or starting from scratch with expensive consultancy projects. Financial Reporting Matrix is built to mirror the structure of classic financial statements directly in Power BI, including custom groupings, subtotals, and sign handling. You keep the presentation finance is used to, but deliver it through interactive, refreshable dashboards instead of static spreadsheets — so month‑end reporting feels like an upgrade, not a rewrite.
Purpose-Built statements
Native matrix visuals in Power BI struggle with the realities of financial statements: ragged hierarchies, irregular subtotal rows, and different formats for different lines. The result is often workarounds, hidden columns, or layouts that don’t match what the board expects to see. Financial Reporting Matrix adds finance-specific capabilities on top of the familiar matrix concept: custom calculated lines, flexible subtotals, ragged hierarchies, stepped layouts, and line‑by‑line formatting, all driven from the data model. You can present P&L, balance sheet, and cash flow in exactly the structure your stakeholders recognise—while still benefiting from drill‑down, cross‑filtering, and other standard Power BI interactions.
Control and consistency
When every business unit maintains its own Excel reports, small changes in logic or formatting quickly create inconsistencies and reconciliation headaches. Finance loses confidence that everyone is looking at the same numbers calculated in the same way. Thousand and decimal separators, negative number formats, and visibility rules (such as hiding empty rows and columns) are all controlled in one place. That gives controllers and CFOs the auditability and consistency they need, without taking flexibility away from analysts. With Financial Reporting Matrix, calculations and formats are defined centrally in the model, while the visual handles things like measure placement, custom columns, conditional formatting, and in‑cell commenting.
Feature overview
Define custom subtotal rows and groupings without complex DAX workarounds.
Apply line‑by‑line formatting to highlight totals, headers, and key metrics.
Use ragged hierarchies to reflect real‑world account structures and reporting lines.
Place measures exactly where you want them across multiple column headers and periods.
Expand and collapse rows and columns to move from summary to detail in the same report.
Add in‑cell comments so finance can document assumptions and explain unusual movements.
Apply conditional formatting rules to quickly spot variances, negative trends, and threshold breaches.
Hide empty rows and columns automatically to keep reports clean and focused.
Control thousand and decimal separators centrally for consistent presentation across all reports.
Export finished reports to Excel with one click when stakeholders still need a spreadsheet copy.
Use custom columns and measures to add KPIs such as margins, growth rates, and index numbers.
Keep headers visible with sticky row and column headers when scrolling through long statements.
Leverage Power BI’s cross‑highlighting and cross‑filtering to connect financial statements with underlying operational data.
Configure everything through the standard Power BI fields and formatting pane—no separate designer needed.
Reuse report structures defined in Profitbase, so you don’t rebuild layouts in Power BI.
See how Hypergene can support your organization
Hypergene gives you the tools to manage planning, follow‑up and analysis with clarity and confidence. See how in a demo.