Turn your data into confident decisions
Connect all your financial, HR, and operational data in one shared view, and explore it through intuitive, guided analysis that brings clarity to performance and trends. With timely, relevant insights automatically delivered to the right people, leaders across the organisation gain the visibility they need to act decisively—strengthening governance, sharpening follow‑up, and driving better outcomes.
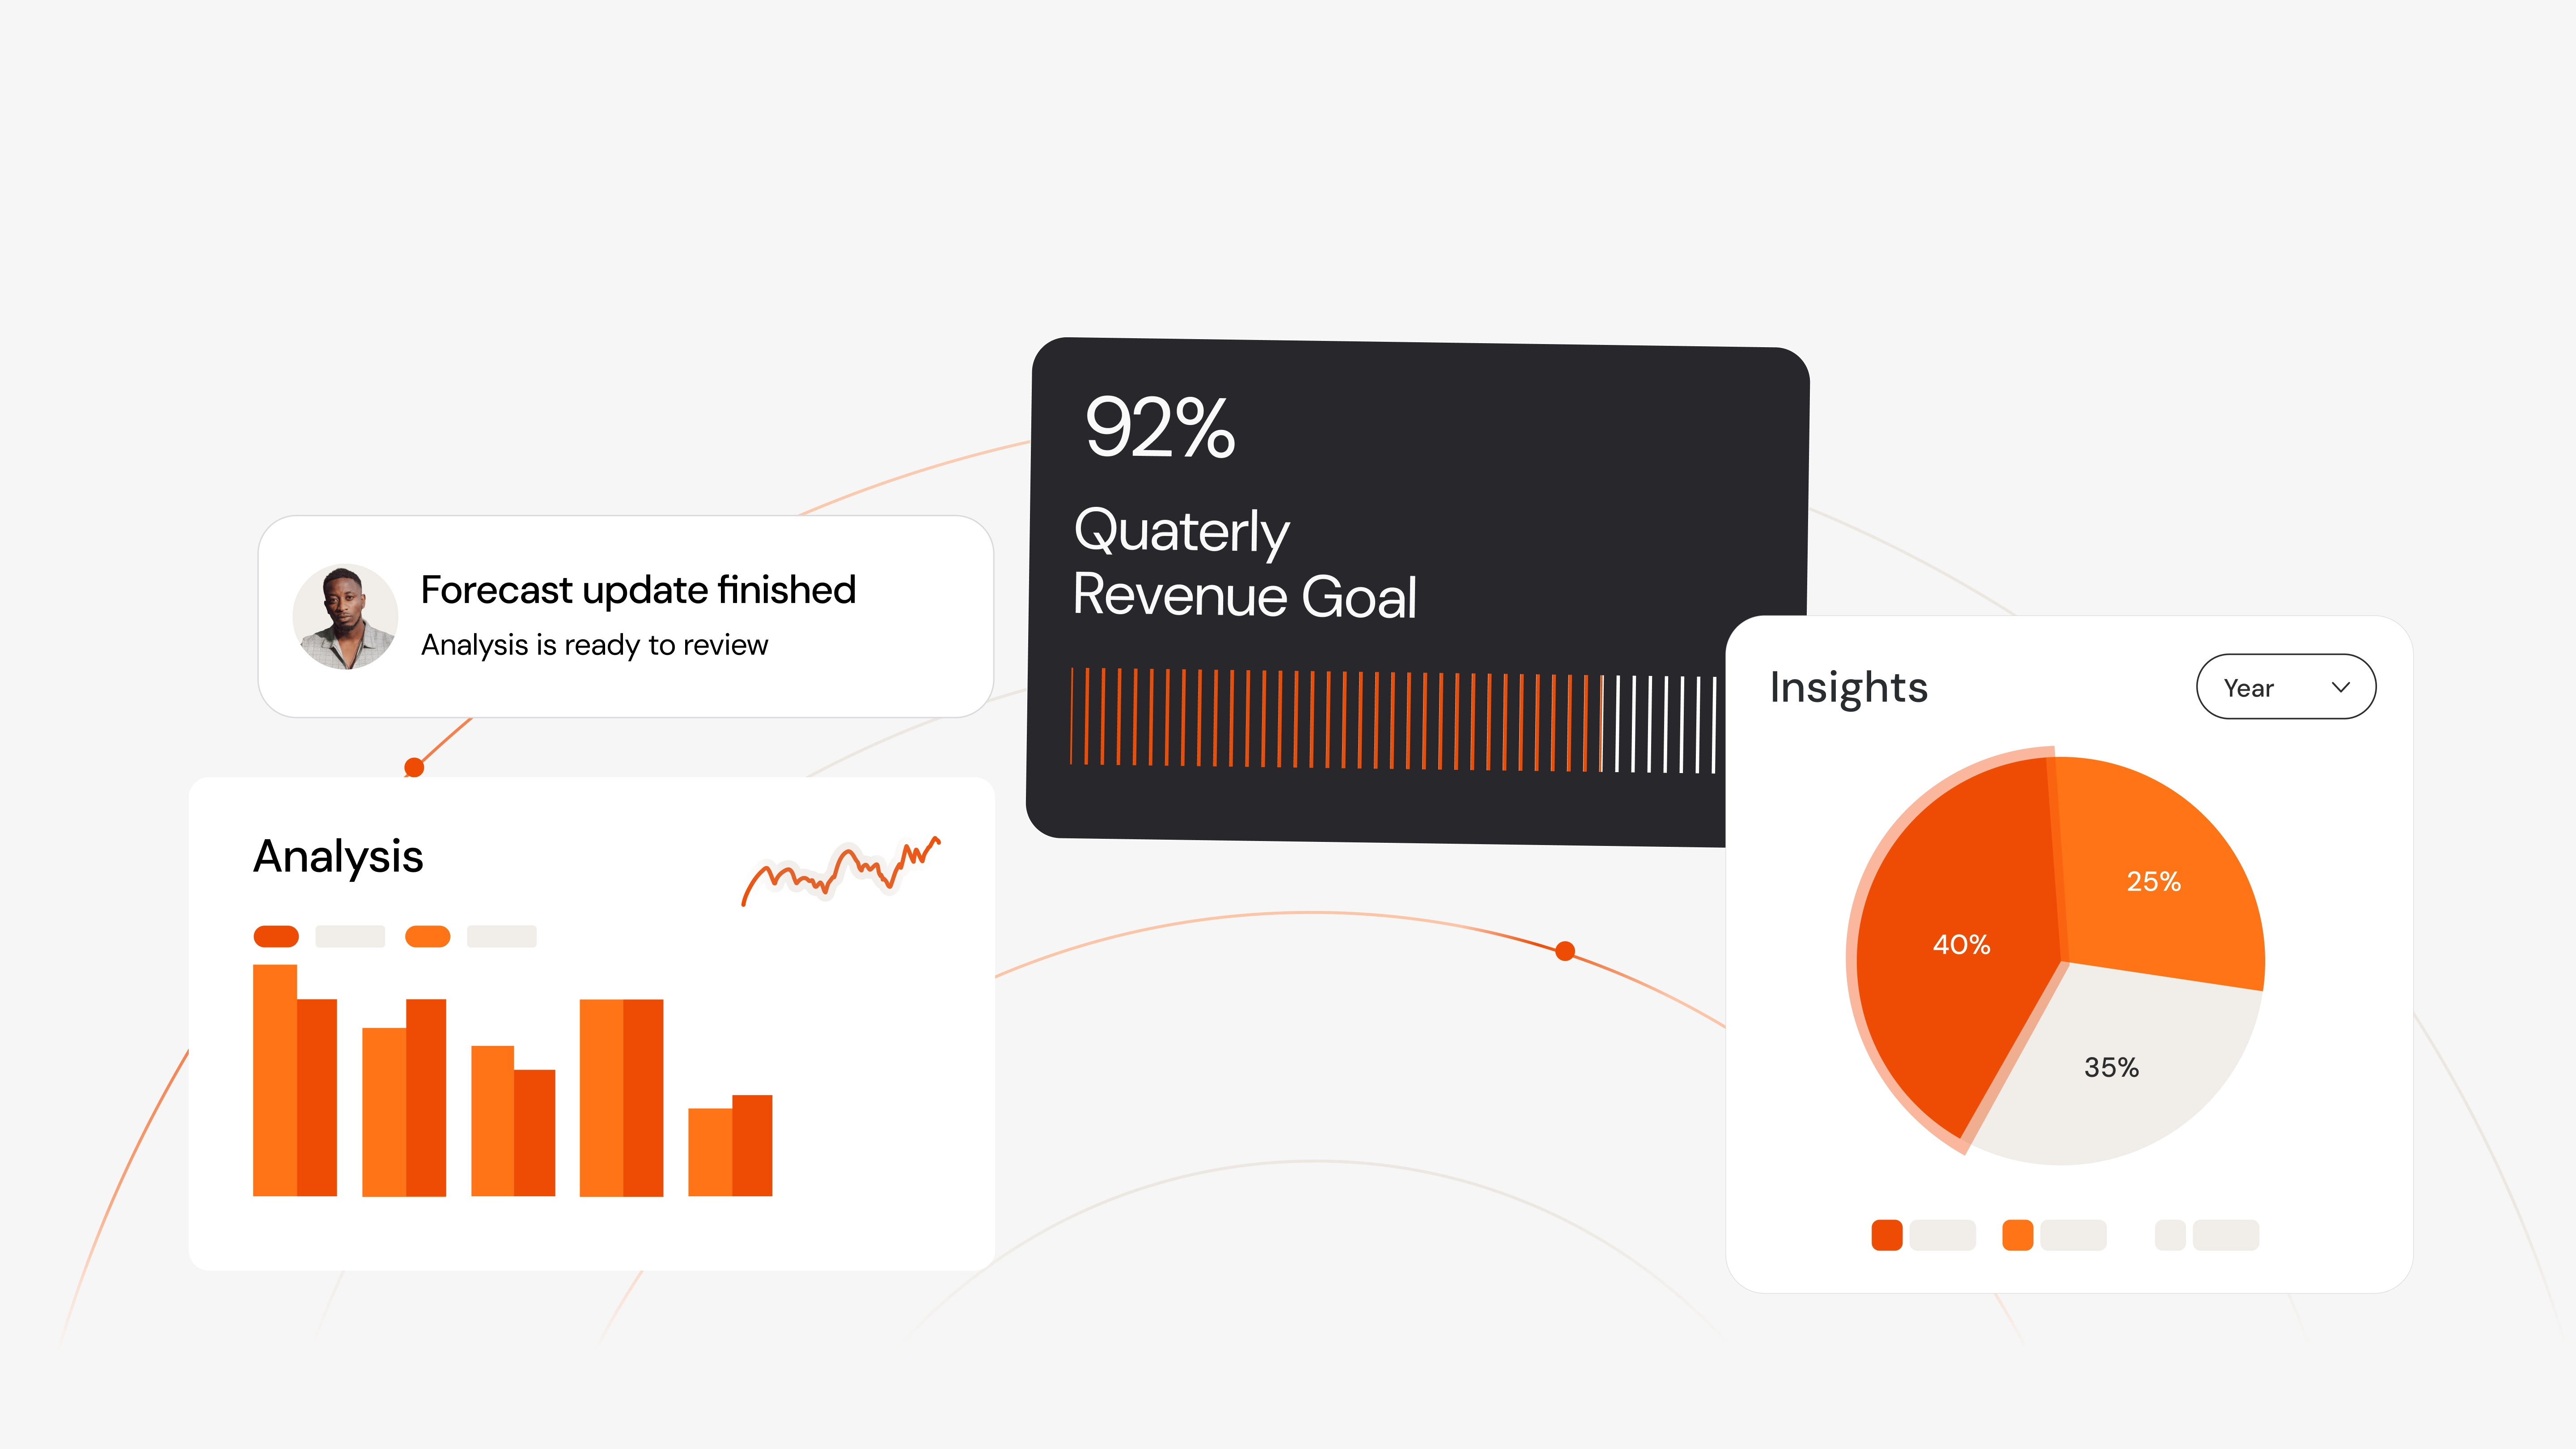
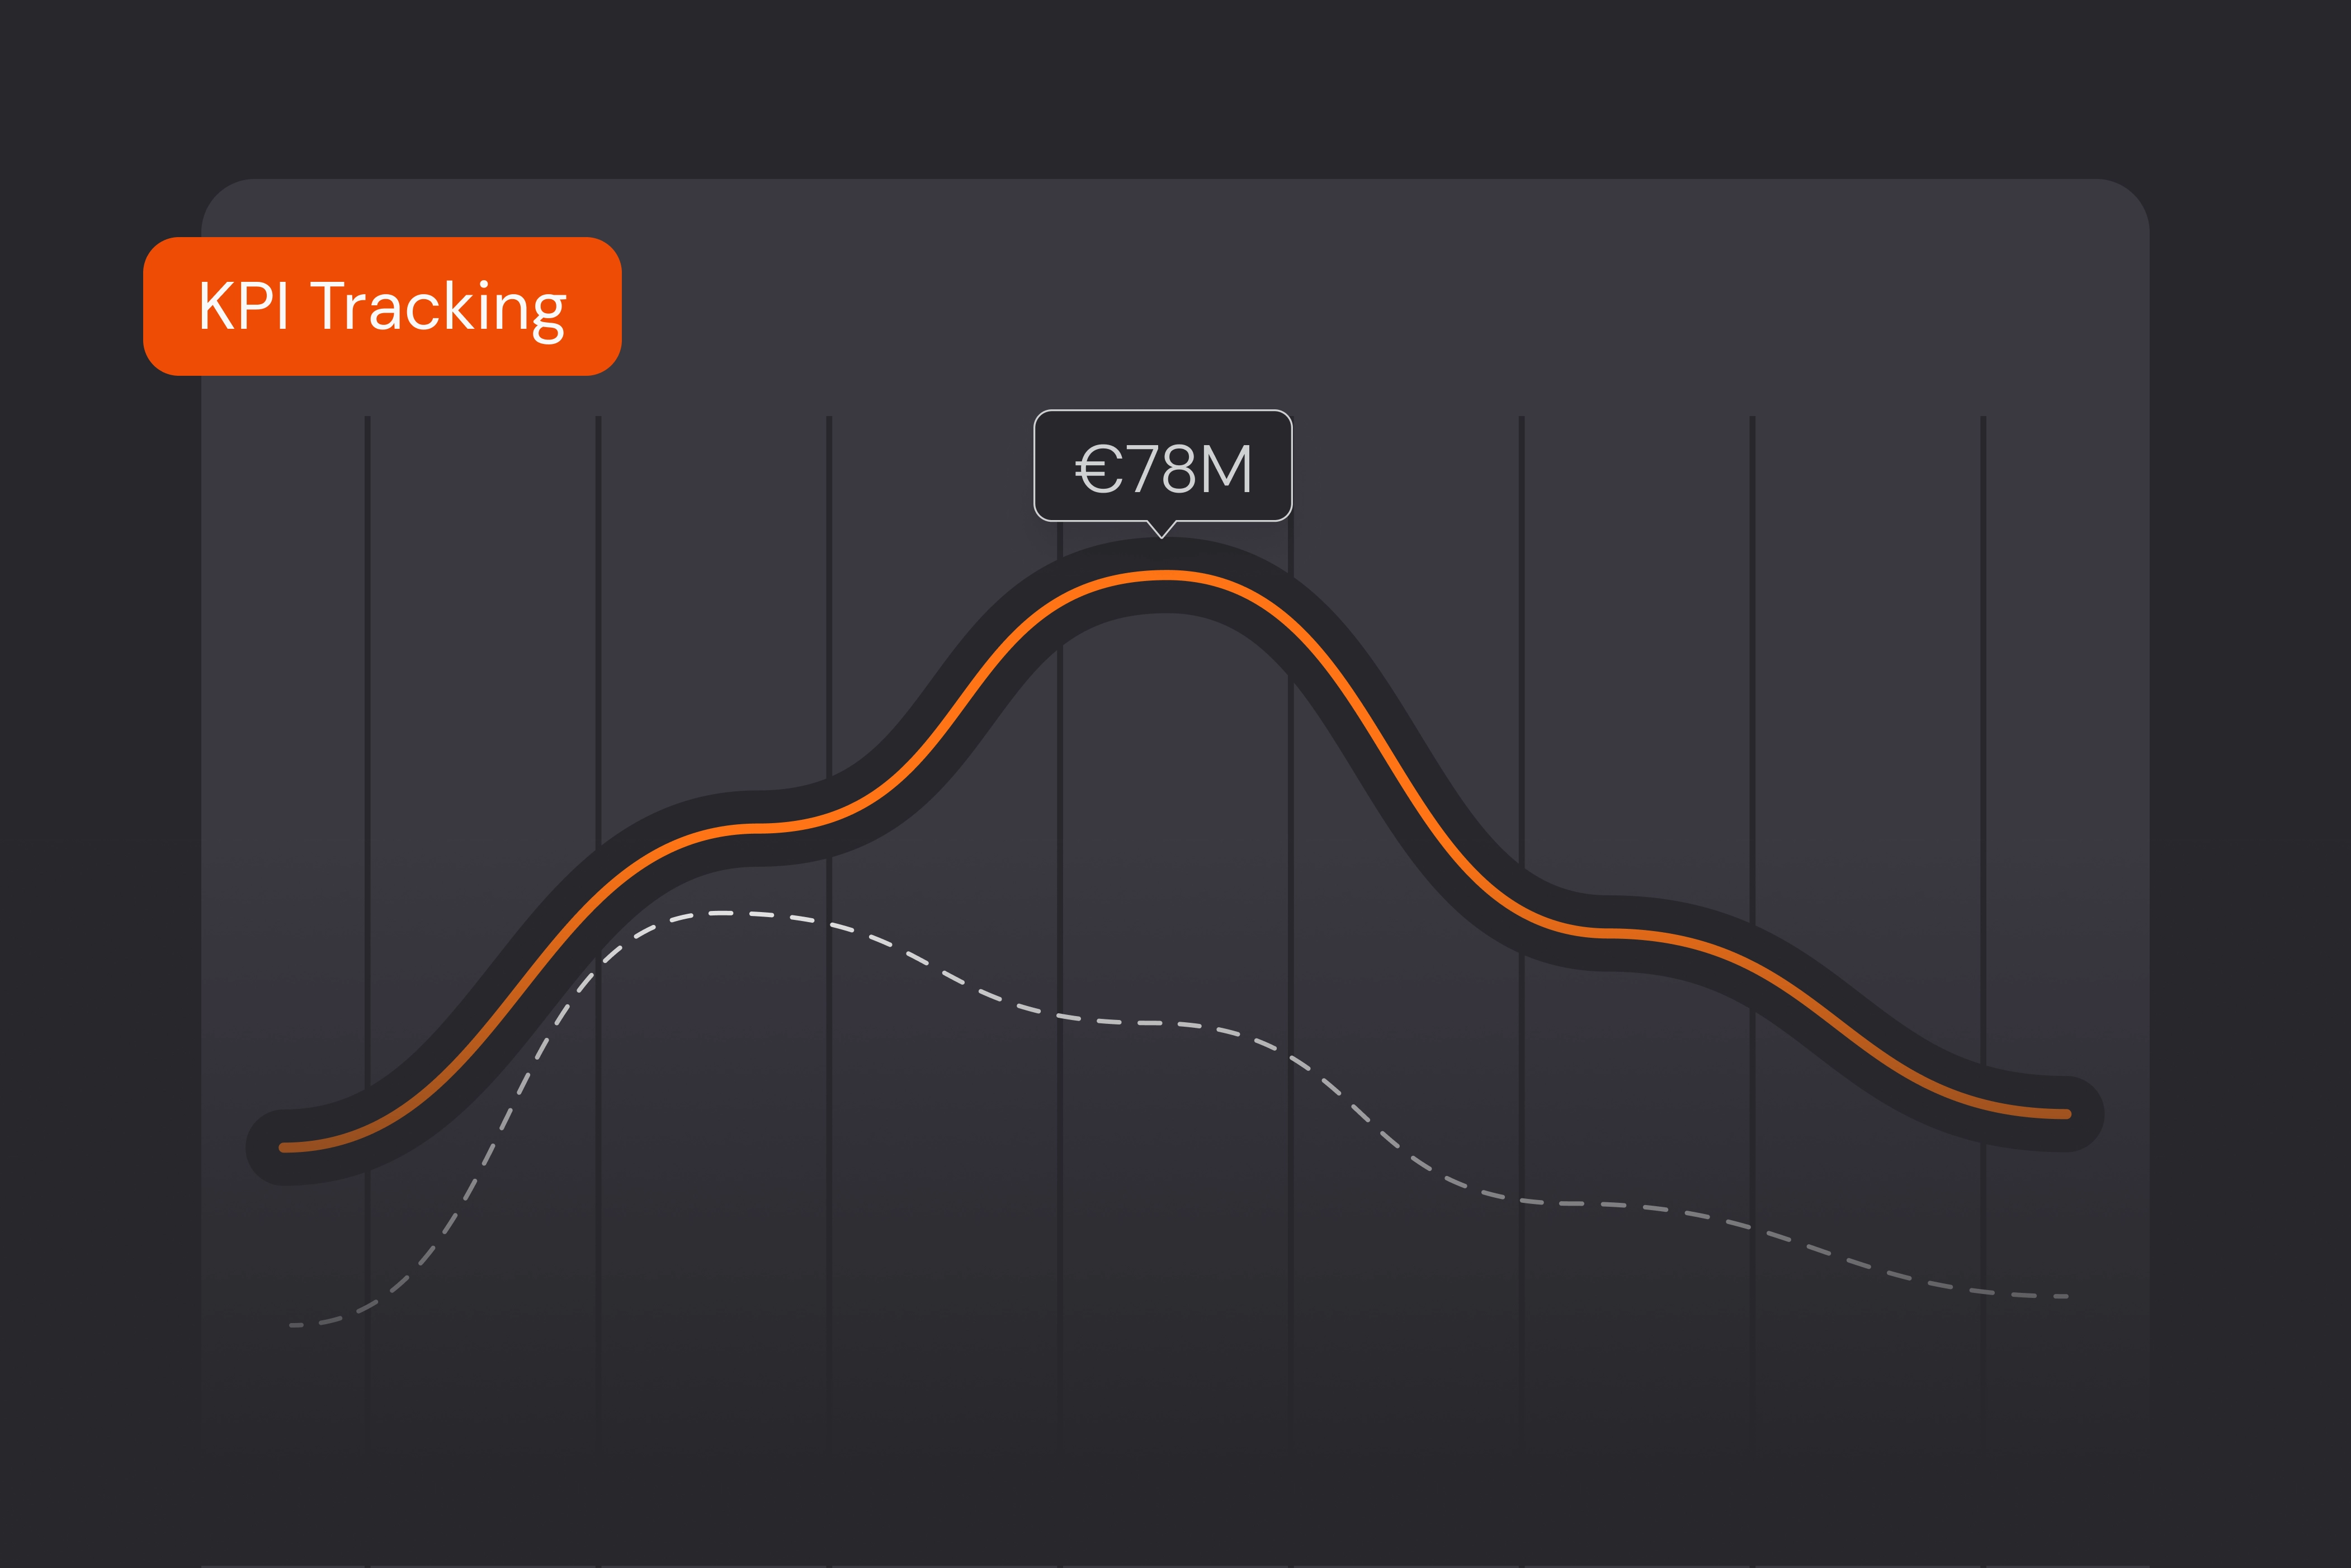
Unified business insights
Bring all your financial, HR, and operational data into one shared view
Consolidate data across systems and visualise it clearly, giving managers and finance teams fast access to reliable insights — creating a shared foundation for smarter, fact-based decisions.
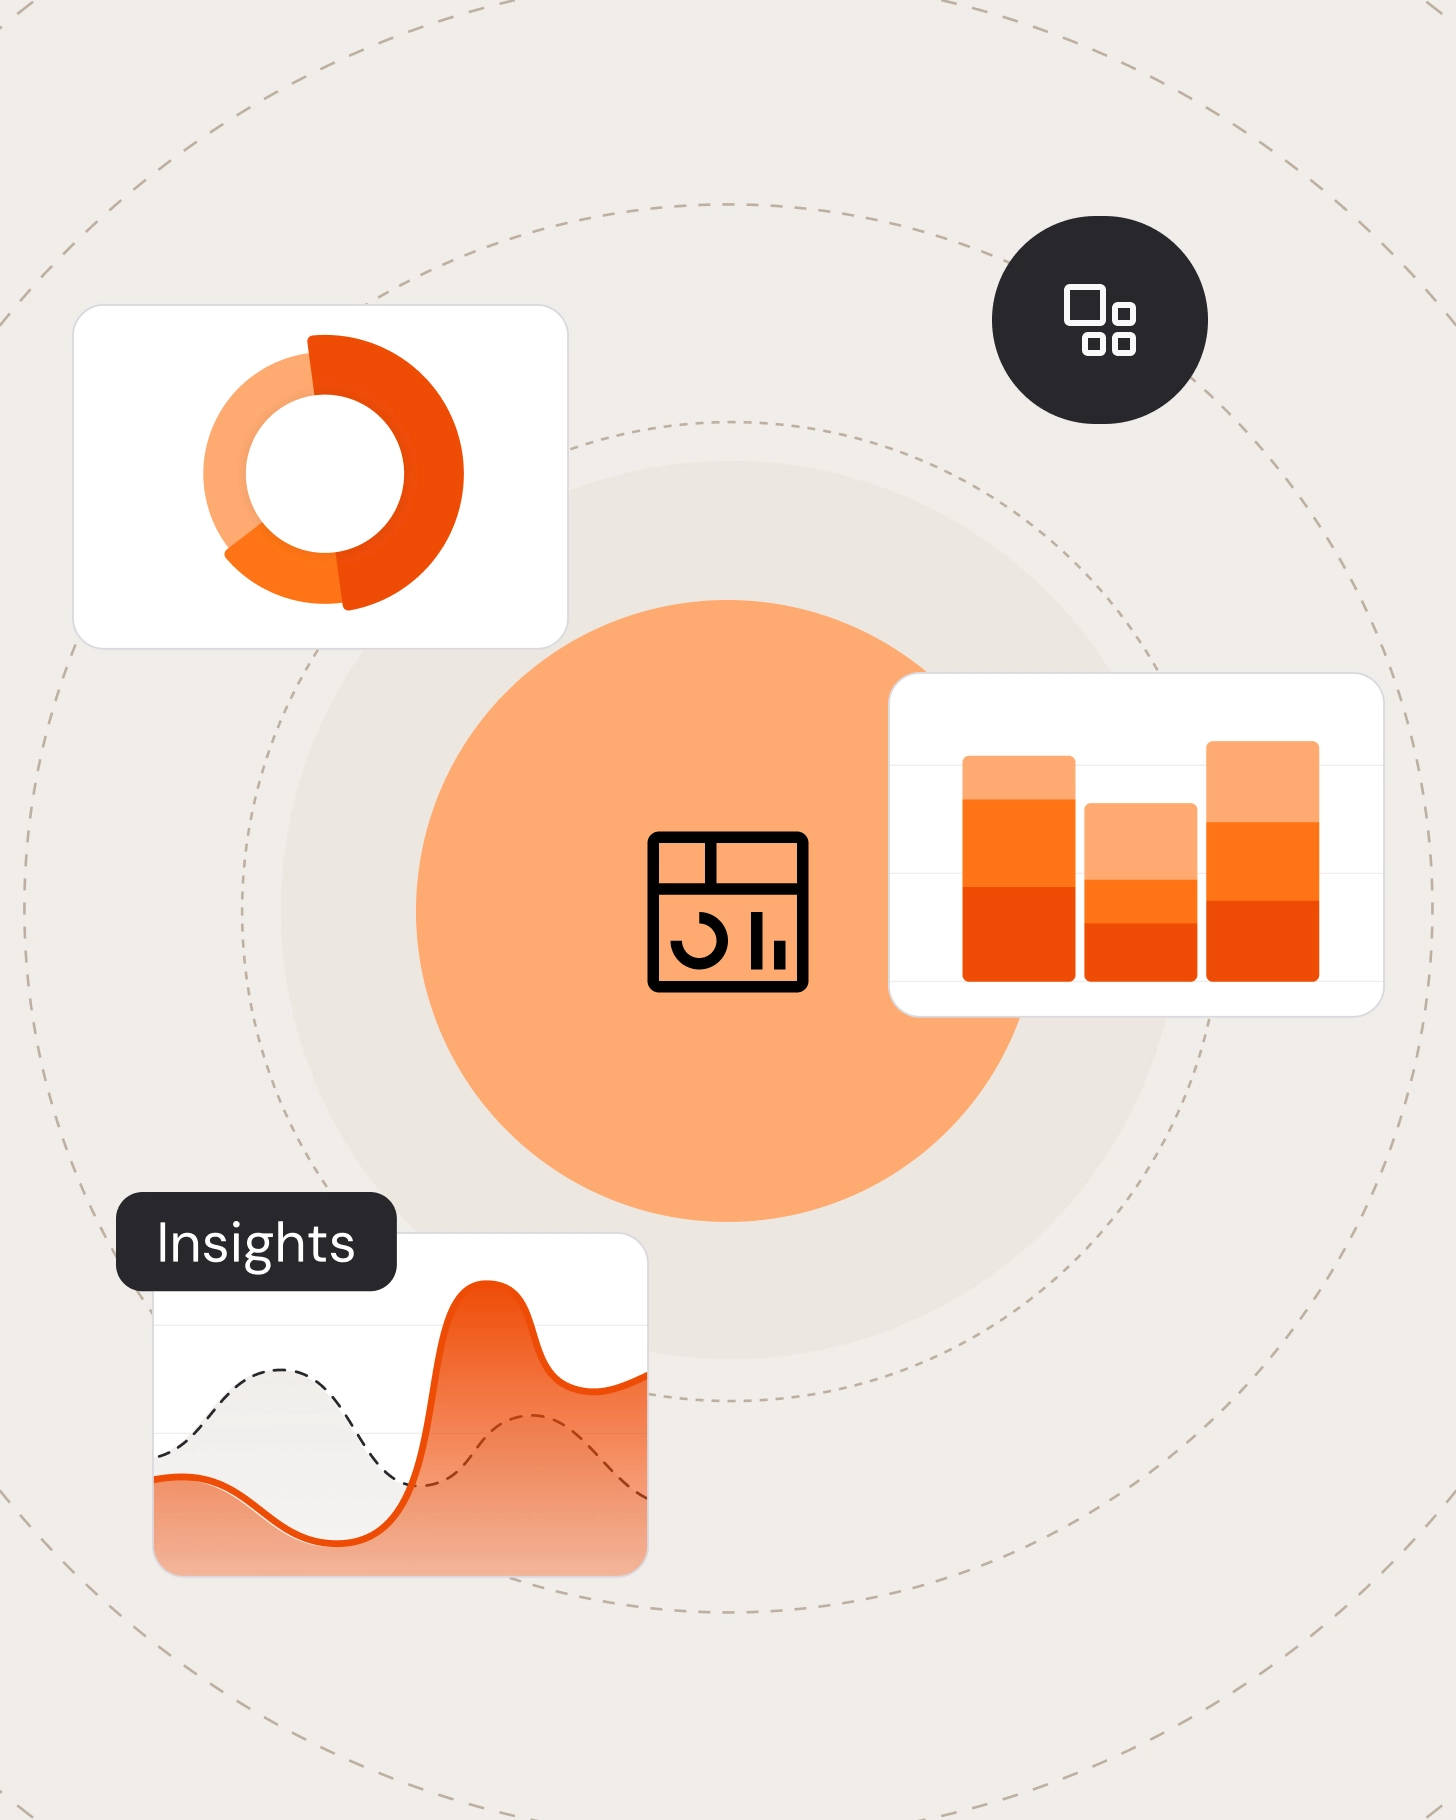
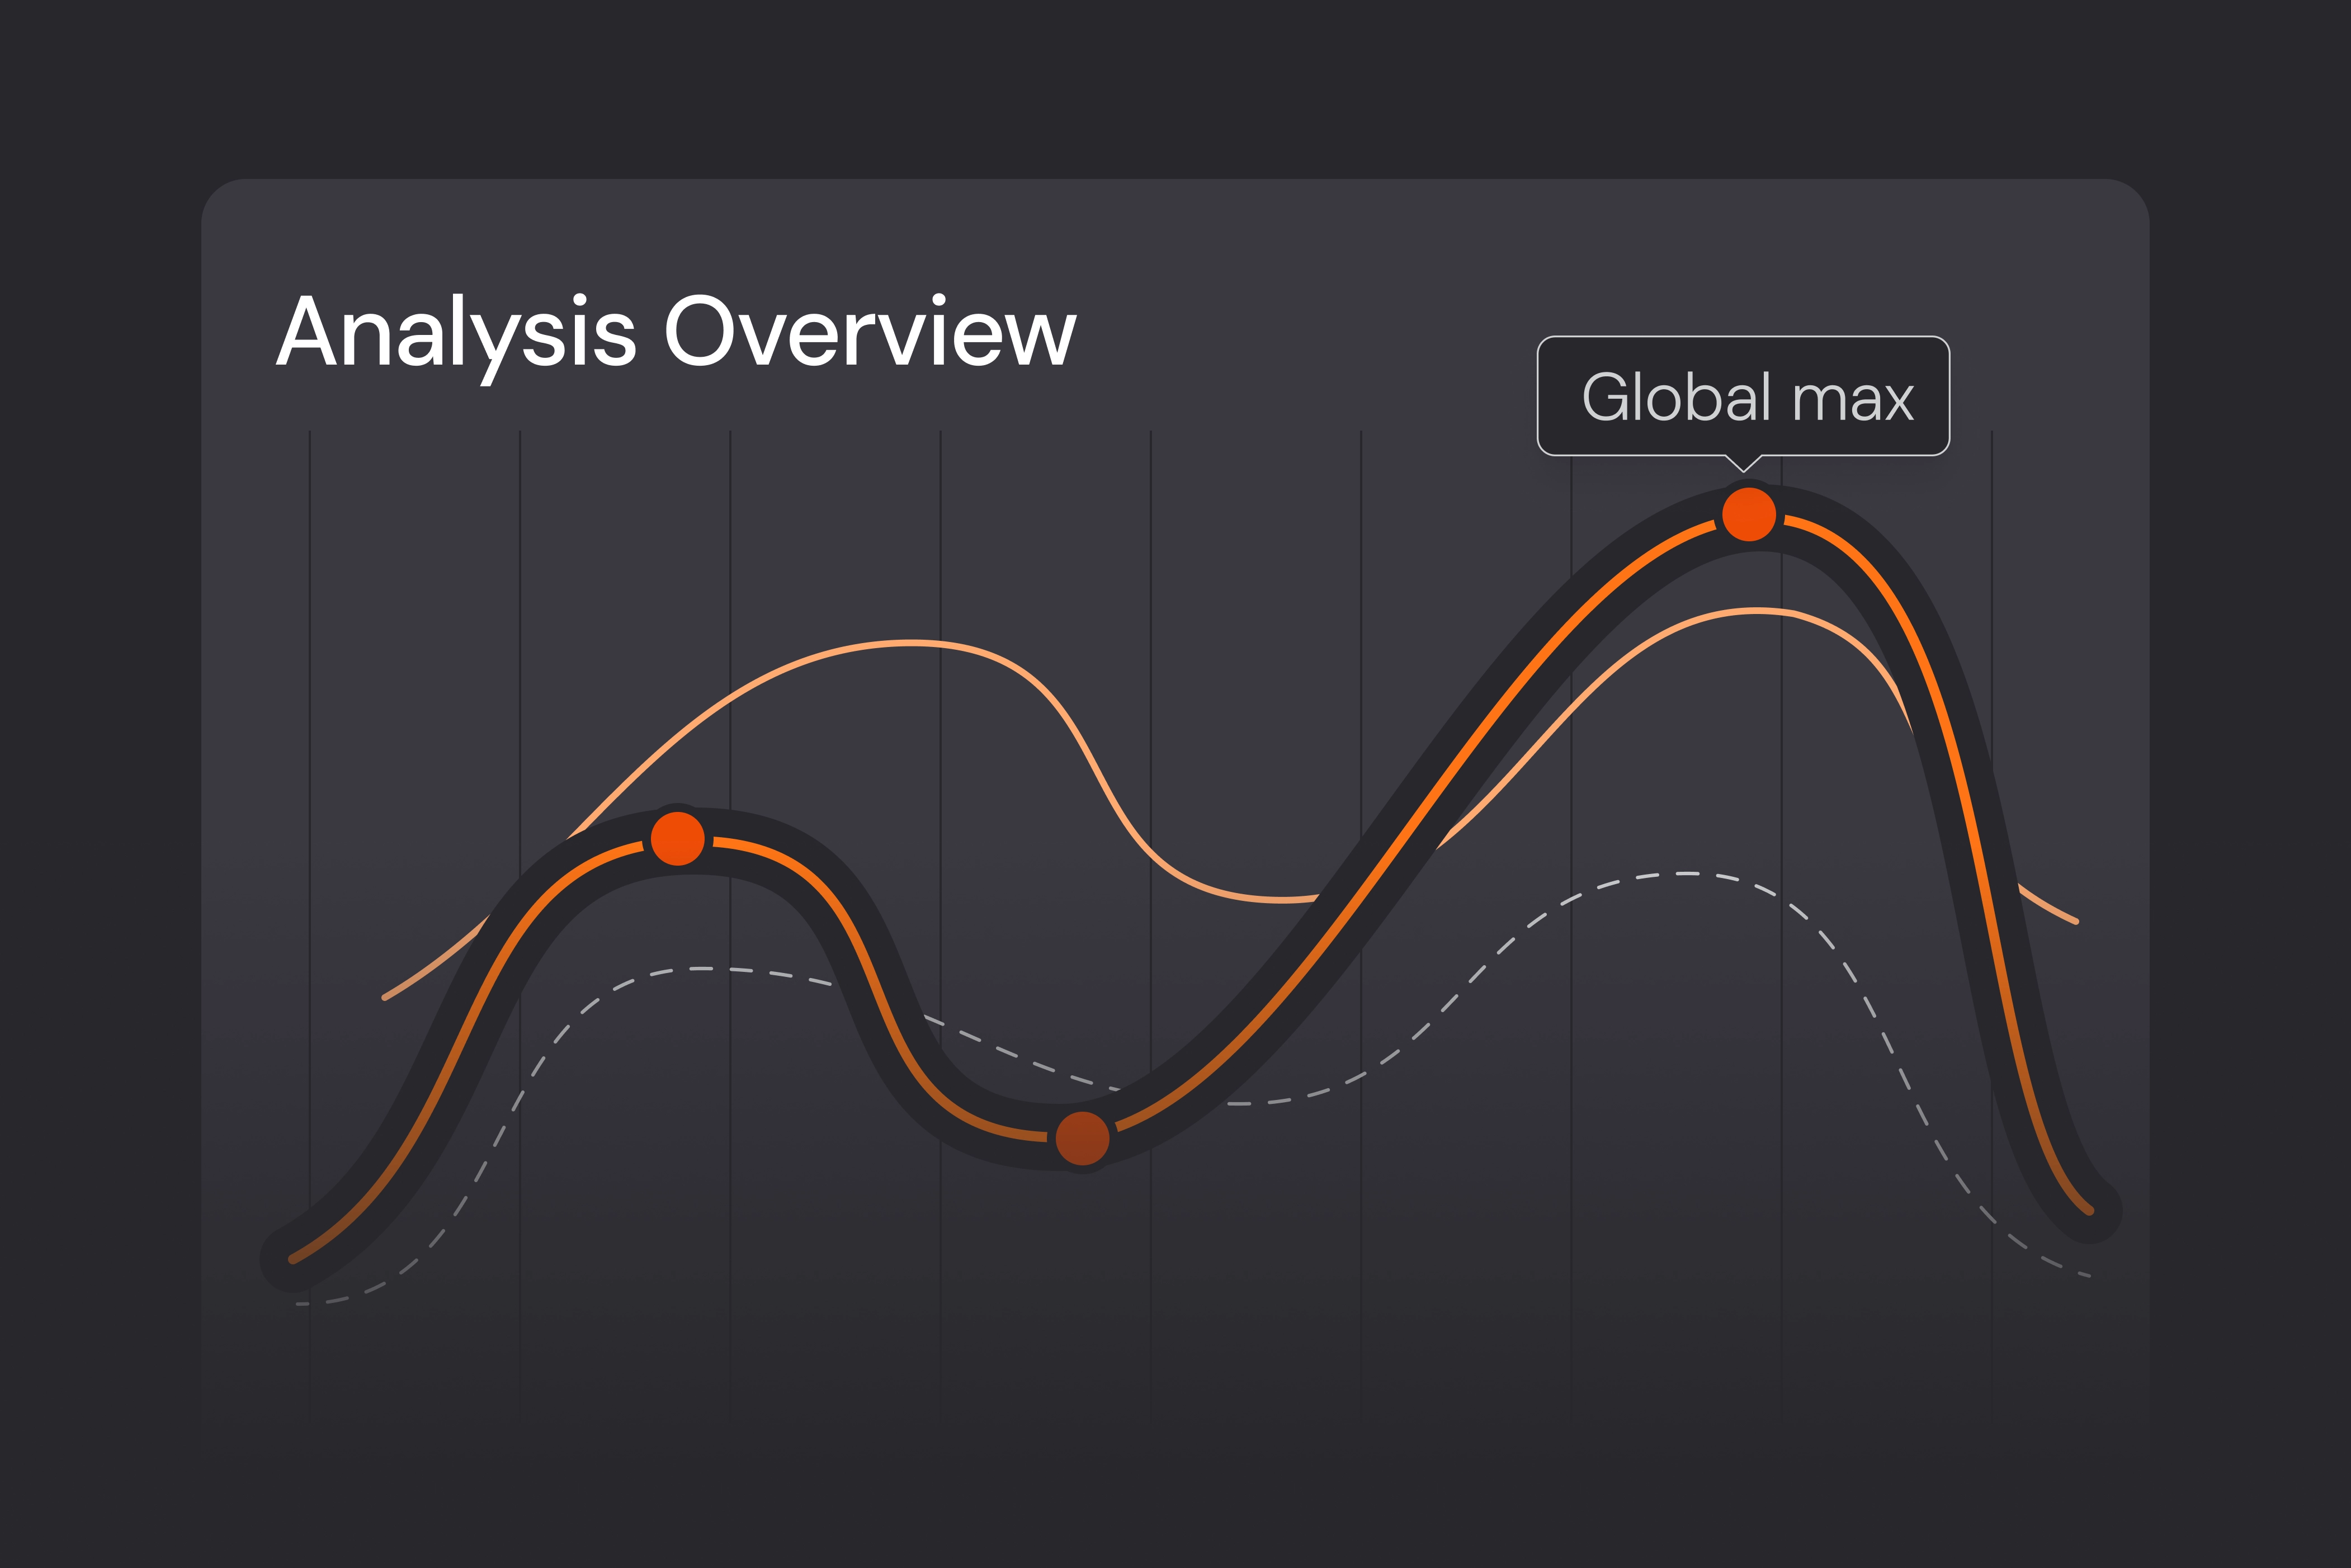
Guided, deeper analysis
Explore your data with intuitive, guided analysis down to transaction level
With seamless integrations and drill-down capabilities, easily analyse performance, spot deviations, and understand the story behind the numbers. Complex analysis becomes accessible to more people.
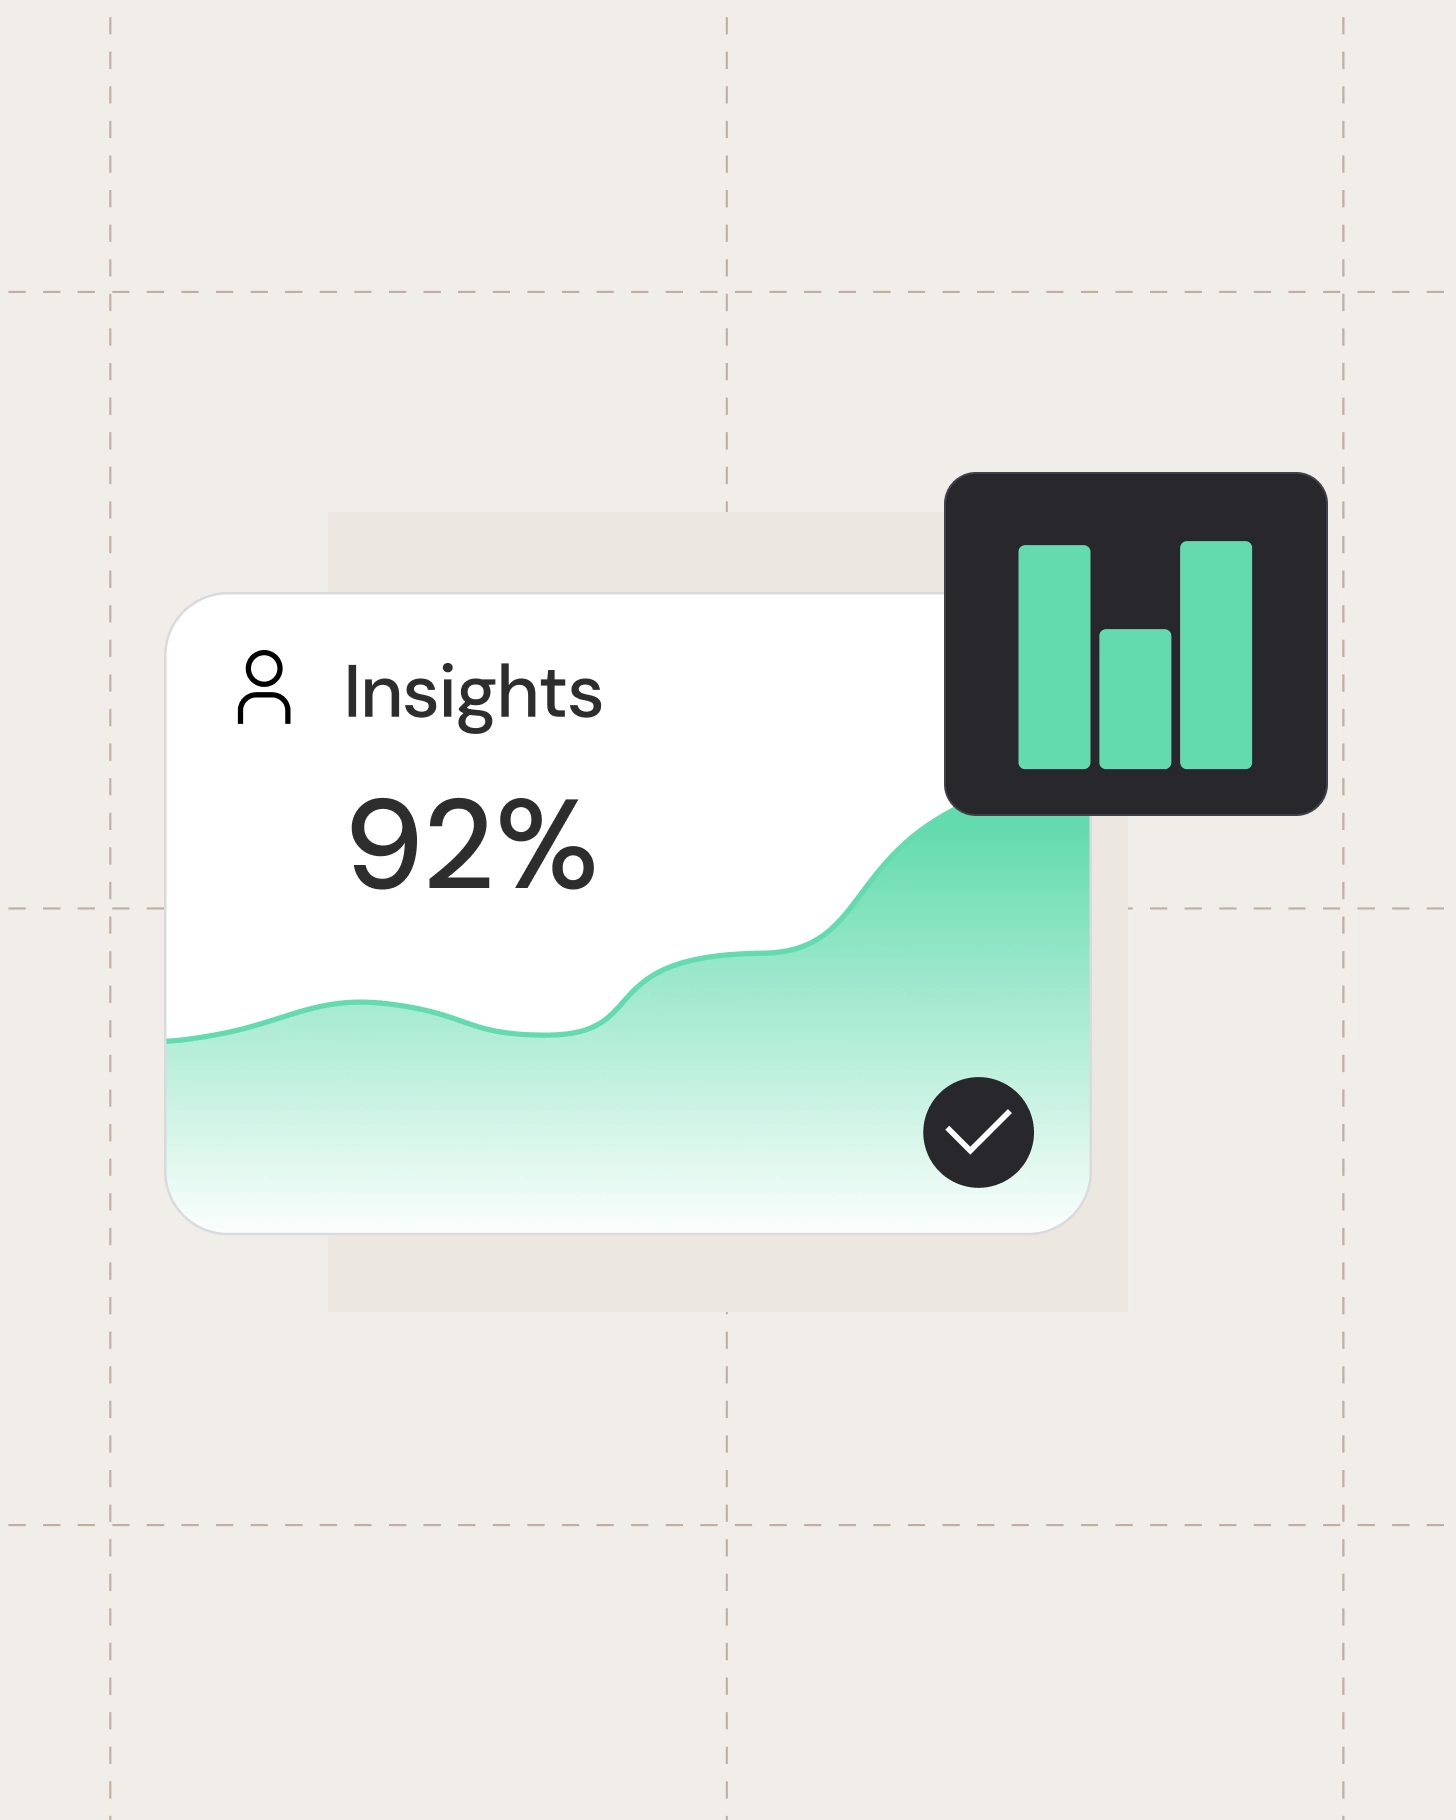
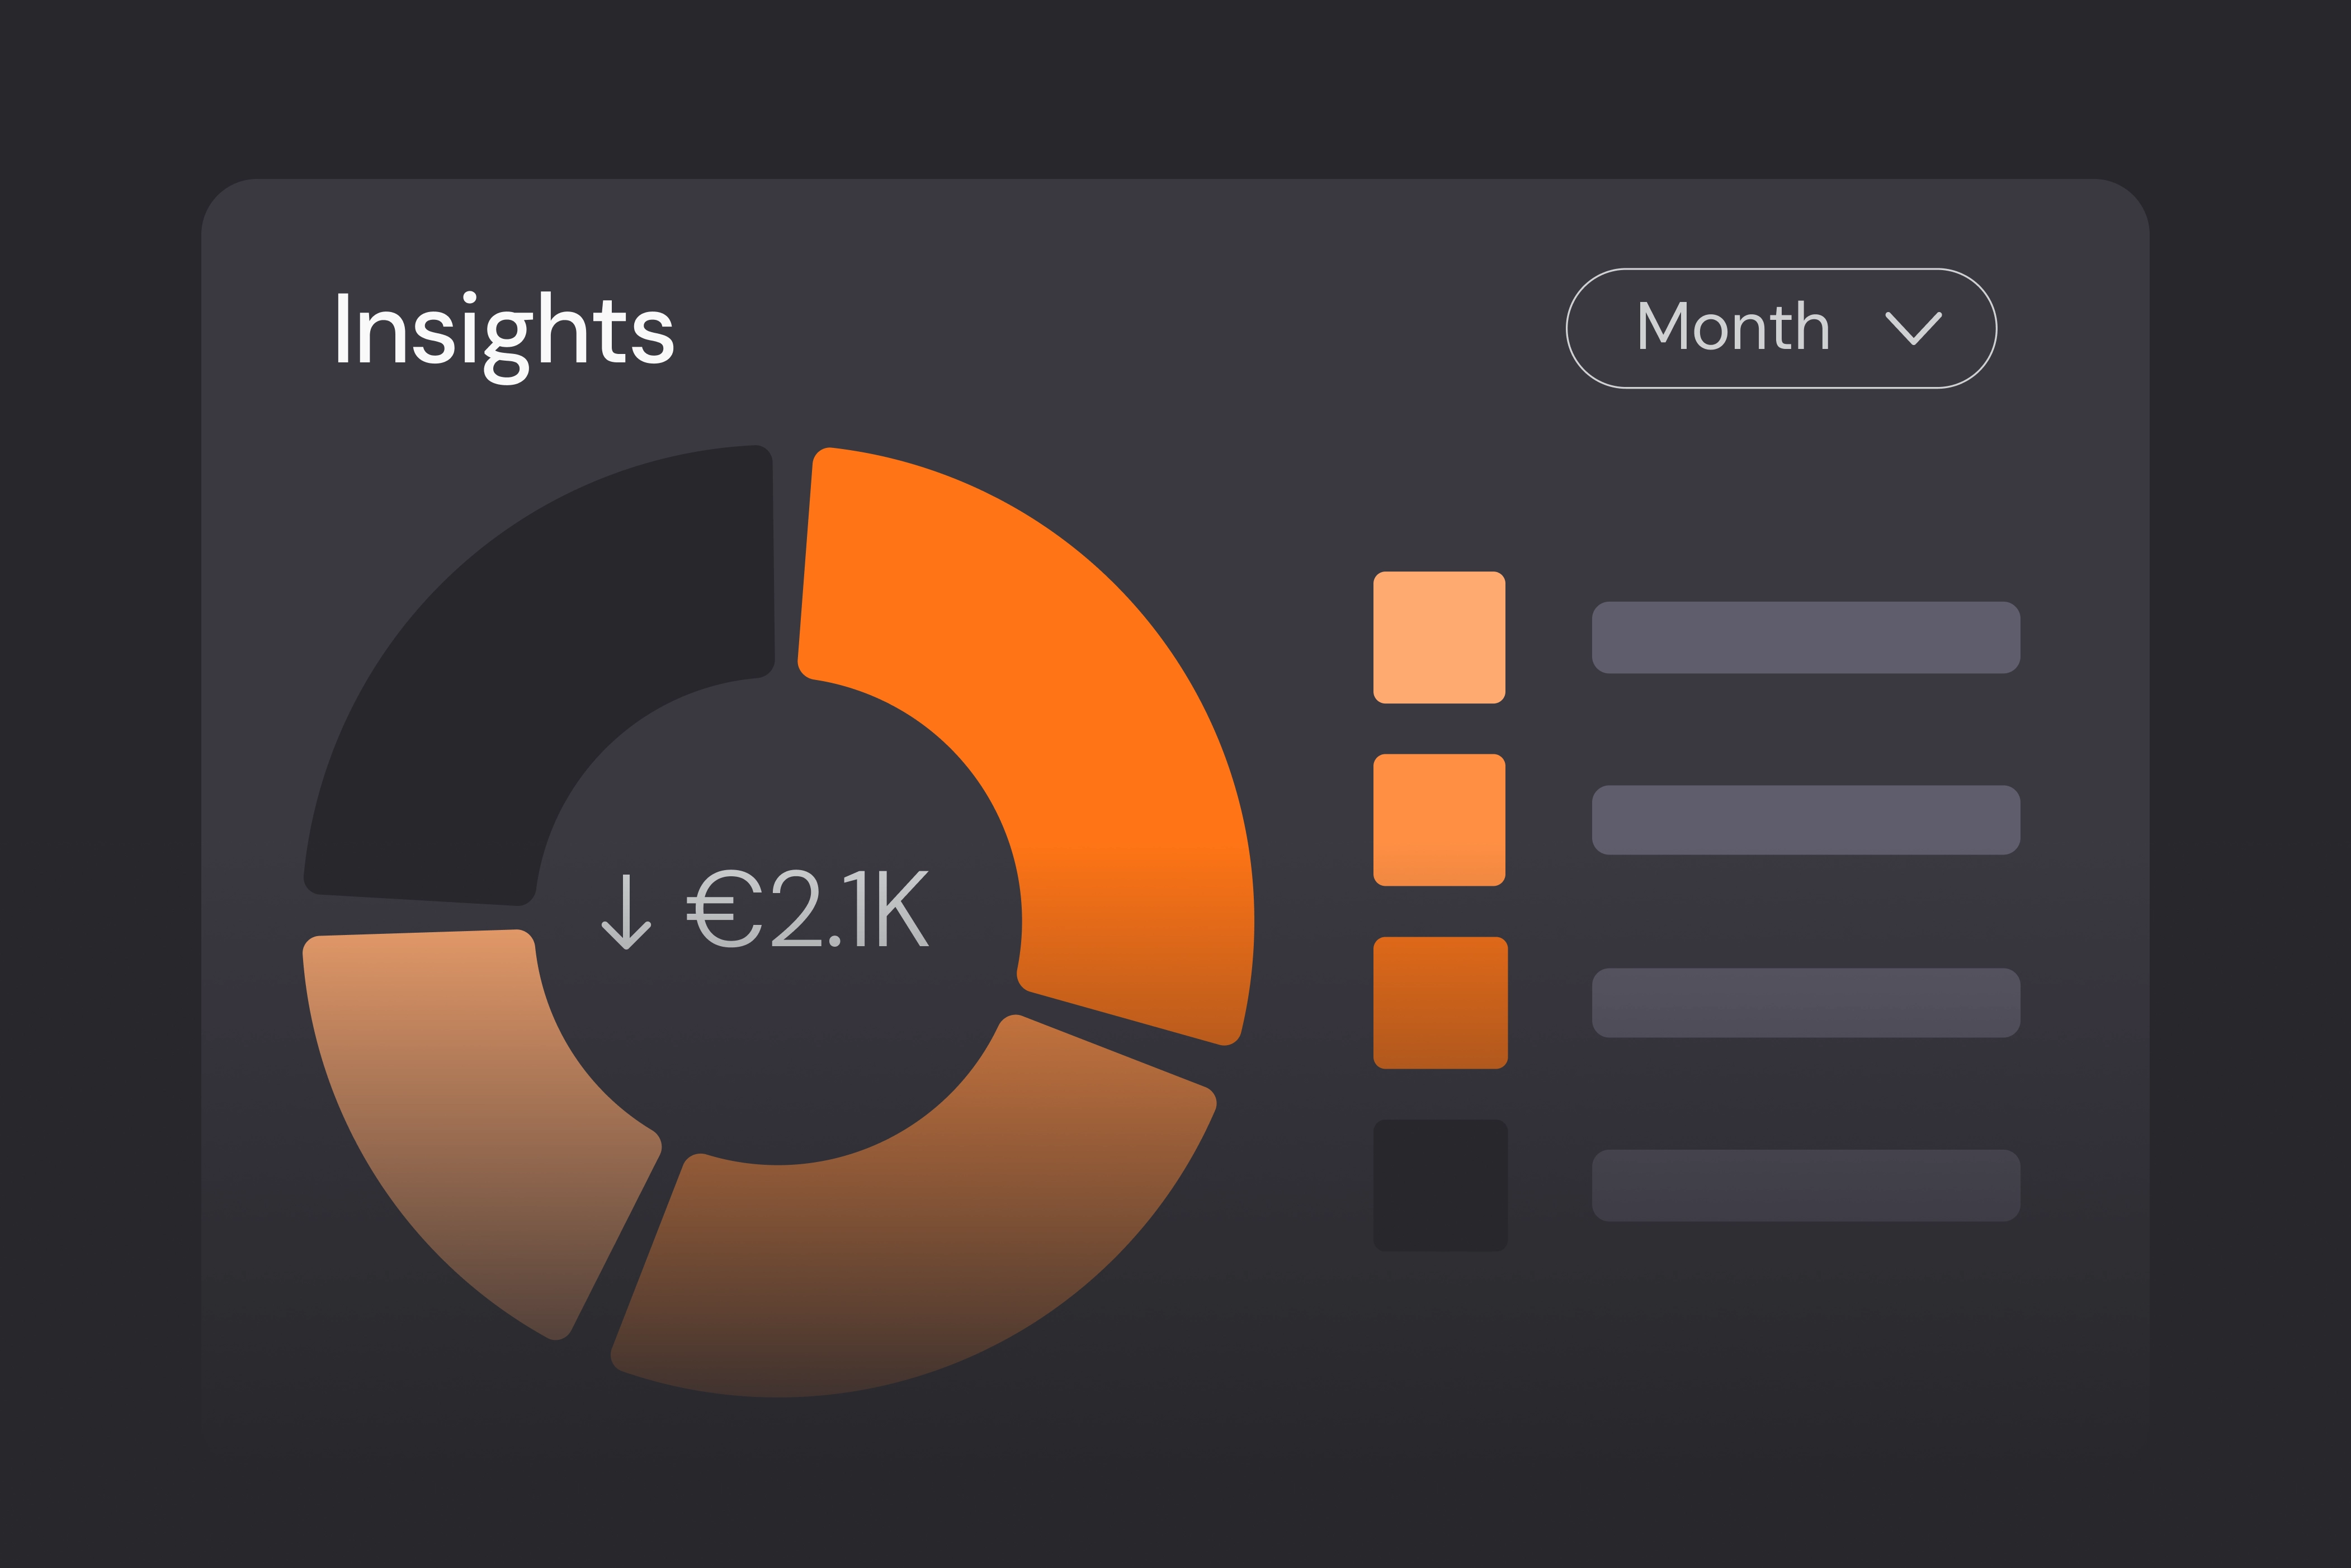
Decision support for everyone
Give leaders at all levels the information they need to make confident decisions
Industry-optimised reports and automated distribution ensure decision-makers always have timely, relevant data. The result is better governance, clearer follow-up, and stronger outcomes across the organisation.
Feature Overview
Access role-based dashboards and tailored overviews.
Gather information from multiple sources in one place.
Configure income statements and balance reports to fit your needs.
Use pivot reports, interactive BI views, and export data to Excel.
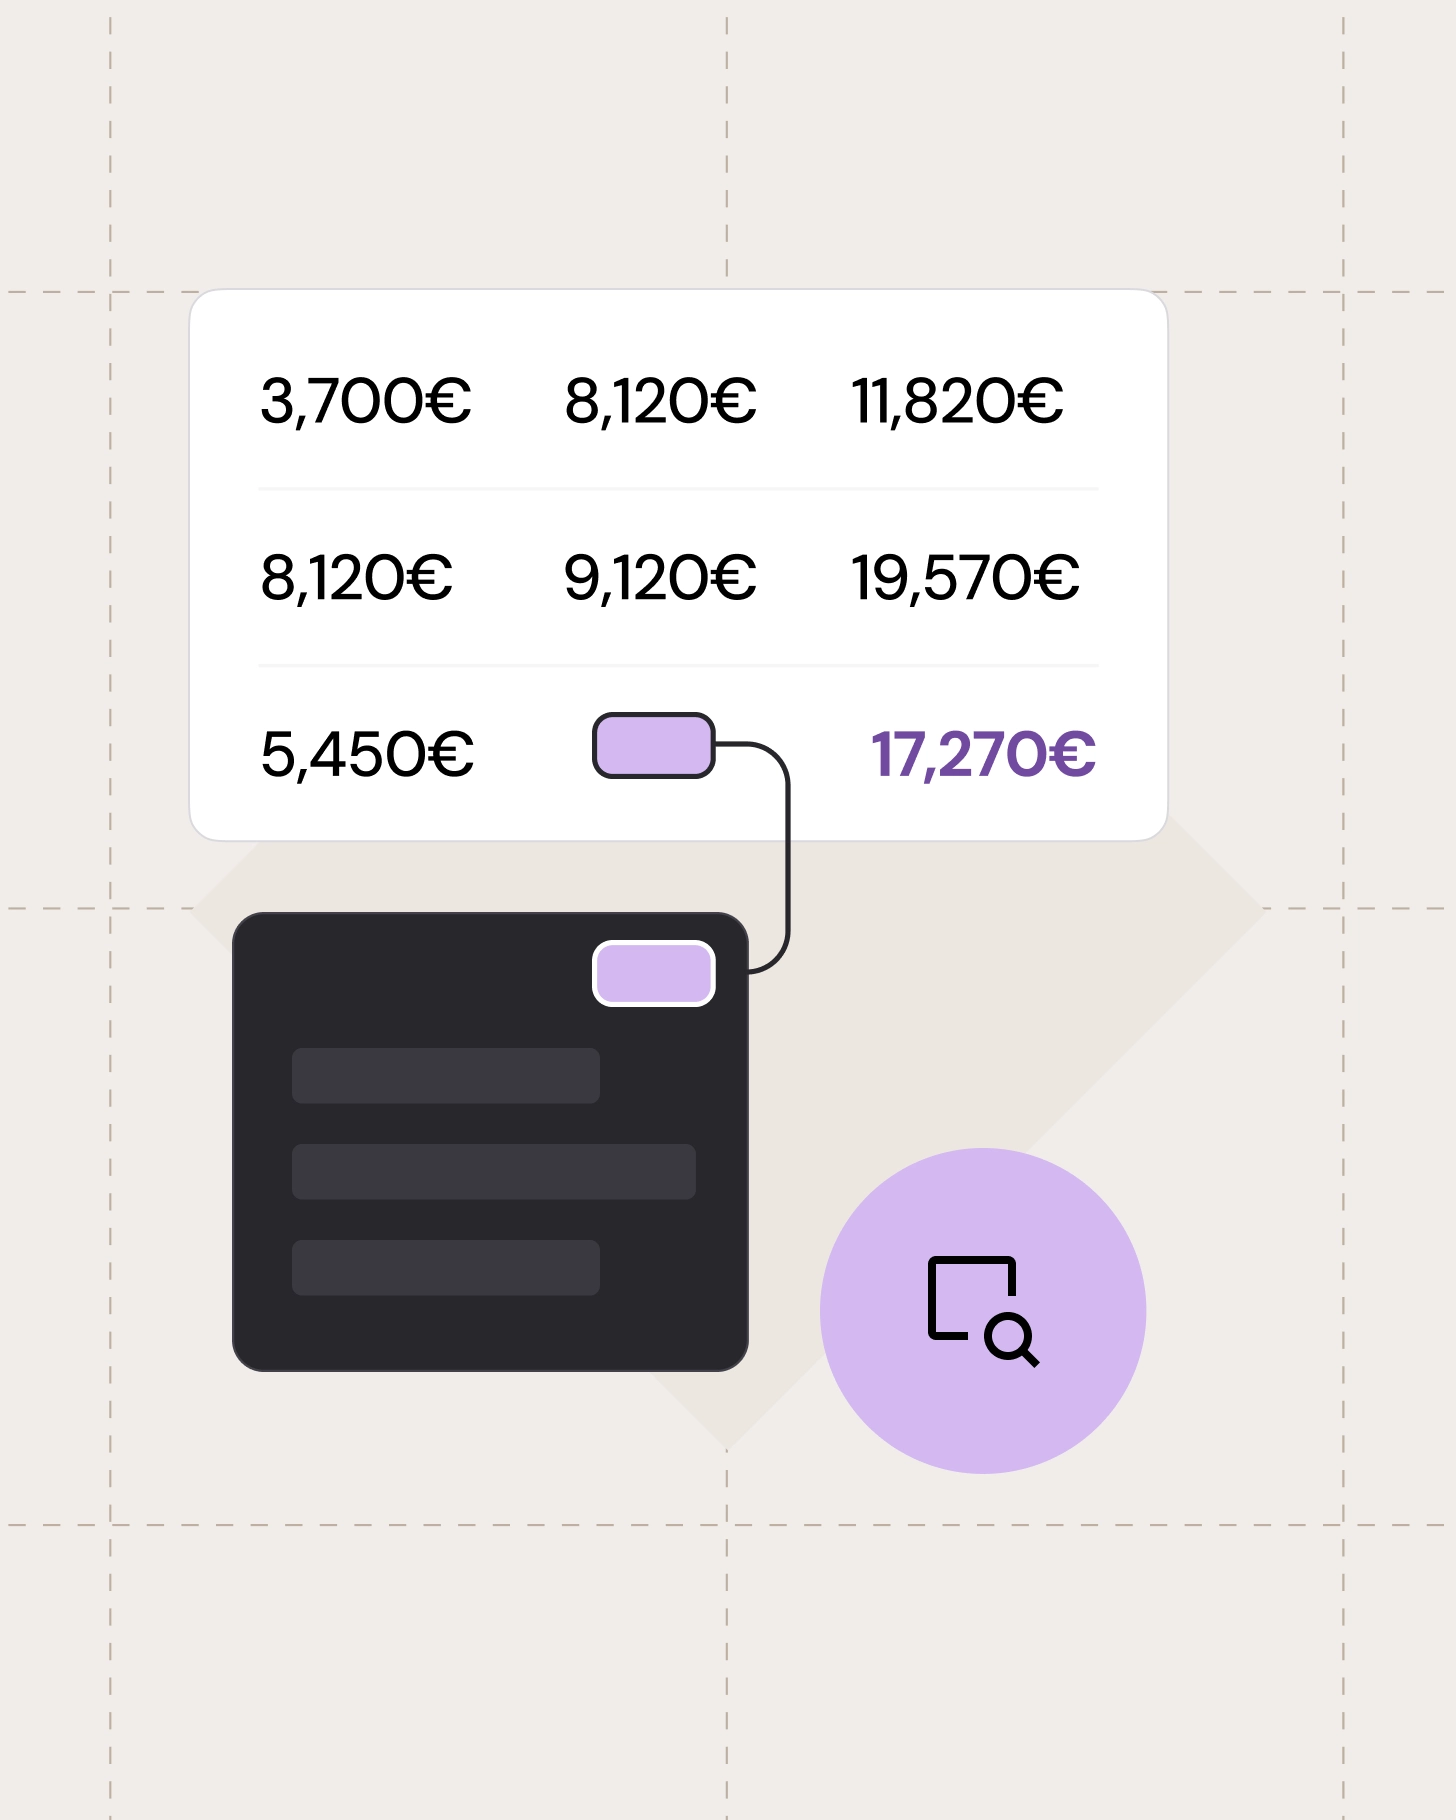
Drill down into details, including invoice images and transactions.
Analyse data flexibly, adapted to different user groups.
Moduler som ingår
Varje ingående modul kopplas direkt till produkten och tillför fokuserad funktionalitet för ert team.
Financial analysis for better control
Embedded financial analysis gives you the insights and control needed to make better decisions. Access the information you need in a structured, reliable way, supporting improved understanding of financial performance.
Extra
Financial analysis for better control
Embedded financial analysis gives you the insights and control needed to make better decisions. Access the information you need in a structured, reliable way, supporting improved understanding of financial performance.
Extra
Track spend across the organization
Spend Analysis enables you to track spend and monitor supplier contract compliance across the organisation.
Extra
Track spend across the organization
Spend Analysis enables you to track spend and monitor supplier contract compliance across the organisation.
Extra
Industry optimised analysis and reporting
Pre-packaged analysis and reporting for public sector, real estate firms and purpose-driven organisations
Extra
Industry optimised analysis and reporting
Pre-packaged analysis and reporting for public sector, real estate firms and purpose-driven organisations
Extra
Kundcase
"Verksamhetsrapportering har gett oss bra förutsättningar för kvalitetshöjning i våra olika rapporteringar. Istället för att lägga tid på att ta ut siffror enligt separata anvisningar kan de som ska göra rapportering fokusera på själva analysen".
Elisabeth Pupp, arbetar med riskprocessen Lunds universitet
Elisabeth Pupp, arbetar med riskprocessen Lunds universitet
“Modulerna vi började med var väldigt användbara. Vi har digitaliserat många rapporter med hjälp av dem”,.
Linda Knutsson, EFS-rådet
Linda Knutsson, EFS-rådet
"Det här har inneburit helt andra och bättre möjligheter för oss på VGS att arbeta mer professionellt med lönsamhet per märke tillsammans med våra återförsäljare".
Malin Jansson, Business Management and Dealer Risk Management
Malin Jansson, Business Management and Dealer Risk Management

Ready to turn your data into actionable insight?
See how Hypergene helps you connect data, guide analysis, and empower better decisions across your organisation.